
Who is winning restaurant technology in 2026
In New York City, Toast leads POS at 40% of places with a POS seen, and Resy leads table booking at 55% of places that take table bookings. 43% of open New York City eating and drinking places with recent reviews run two or more of the five systems we track: POS, reservations, online ordering, loyalty and card rewards.
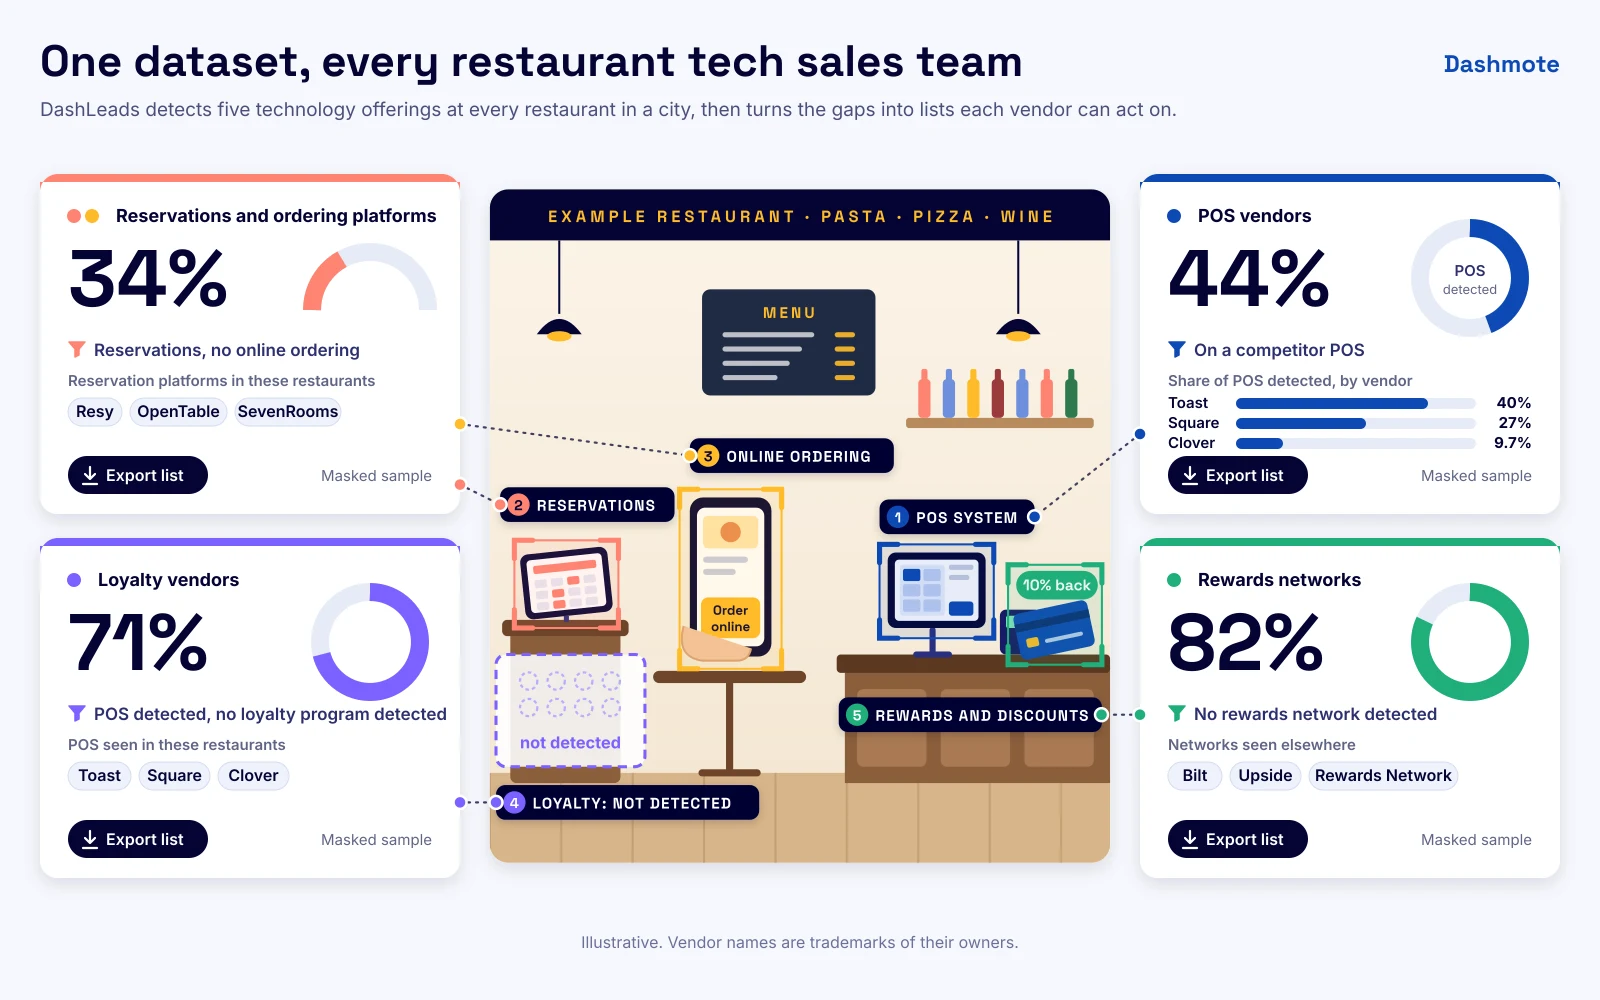
Start with the system you sell
The systems a restaurant runs decide what it can buy next. Each page shows who leads, where they lead, and which restaurants have nothing in that slot yet.
- POS system (EPOS)44% of open New York City eating and drinking places show a POSThe checkout system holds the menu, the prices and often loyalty, so it decides which integrations and partners fit a restaurant.Toast 40%, Square 27%, Clover 9.7% of places with a POS seenPOS market share
- Reservations27% of open New York City table-service restaurants take bookings through a platform (any booking vendor, private-event tools included)Marketplaces, own-website booking software, and the restaurants that take no online bookings at all.Resy 55%, OpenTable 46% of places that take table bookingsReservations market share
- Loyalty16% of open New York City eating and drinking places show a loyalty programmeThe slot most restaurants leave empty: 71% of places with a POS show no loyalty programme.Toast Loyalty 19%, Square Loyalty 16% of places with loyalty seenLoyalty market share
- Online ordering56% of open New York City food-serving places (no bars) show online ordering (37% confirmed in use)The restaurant's own ordering channel: software from the POS or an ordering vendor, or a storefront run by a delivery marketplace.Toast Online Ordering 23%, Grubhub Direct 17% of places with ordering in useOnline ordering market share
- Rewards and discounts11% of open New York City eating and drinking places are on a card-linked or dining rewards networkCard-linked rewards, dining credits and deal apps that pay the guest back.Bilt 41% of places on a rewards networkRewards and discounts
- Delivery platforms74% of open New York City food-serving places (no bars) are listed on a leading delivery appUber Eats, DoorDash and Grubhub listings, and the restaurants on one app only.Uber Eats 62%, Grubhub 60%, DoorDash 59% of open food-serving places (no bars)Delivery platforms
We help restaurant technology companies grow faster
Every share on these pages is backed by the list of restaurants behind it. Sales, marketing and strategy teams at POS, booking, ordering, loyalty and payments companies use it three ways.
- 01
Find the whitespace
See where rivals lead, and which restaurants already run software but leave a slot empty.
New York City places with a POS seen, each on its own base
- table-service restaurants with no booking platform59%
- eating and drinking places with no loyalty programme71%
- food-serving places with no online ordering30%
- 02
Build lead lists
Filter by system, rival vendor, area, venue type and price, then export to your CRM. Restaurants you already serve are marked.
Example: POS places with no loyalty
Venue POS Loyalty Cafe, Brooklyn Square none Pizza, Queens Clover none Bar, Manhattan Toast none - 03
Size the market
Compare cities before you enter one: who leads, and how much open ground is left.
Open food-serving places with recent reviews listed on a leading delivery app
- New York City74%
- Melbourne67%
- London65%
- Booking platforms: restaurants with no booking system, priced by their price level.
- POS and payments: venues on a rival system, and the venue types each system wins.
- Ordering and delivery apps: venues with their own ordering channel, or with none.
- Loyalty and rewards: POS restaurants with no loyalty, and those already on a rewards network.
- Food and drinks brands: promotions and listings planned by the systems a venue runs.
43% of open New York City eating and drinking places with recent reviews run two or more of the five systems.
Share of open New York City eating and drinking places with recent reviews.
Vendors we track at every restaurant











Five systems, one restaurant record
A restaurant's systems decide what you can sell it. A venue with no booking platform is a prospect for a booking platform; a venue on one POS needs a partner of that POS; a venue already on two rewards networks is used to paying commission for guests.
We read five systems for every restaurant, cafe and bar, and put them next to the outlet profile you already use:
| System | What it tells a seller | Example values |
|---|---|---|
| POS | Which checkout system runs the venue | Toast; Square; Lightspeed |
| Reservations | Whether the venue takes table bookings through a platform, and which ones | Resy; TheFork; none found |
| Online ordering | How the venue takes orders on its own channel | Toast Online Ordering; a marketplace storefront |
| Loyalty | Which loyalty programme the venue runs | Toast Loyalty; a loyalty app |
| Rewards and discounts | Which card-linked, dining rewards or deal programmes list it | Bilt; Upside; EatClub |
Online ordering and POS are the systems a restaurant shows most often; loyalty and card rewards are rarer, so that is where most of the open ground sits for a vendor.
POS here means the point-of-sale system, the checkout software. For posters, menus and fridges in the venue, see POS material detection. How we count bookable restaurants.
Each bar on its own base, named under its label: open New York City places with recent reviews.Online ordering includes ordering links on Google listings; 37% of places have ordering confirmed in use.
Show the data as a table
Of the five systems, online ordering and POS are the most visible. Each bar on its own base, named under its label: open New York City places with recent reviews.
| Share | |
|---|---|
| Online ordering | 56% |
| POS | 44% |
| Reservations | 27% |
| Loyalty | 16% |
| Rewards and discounts | 11% |
How many systems a restaurant runs
Most places show one system or none in public data; a small group runs four or five. The venues with deep stacks are the ones every vendor already fights over; the ones with one system are the easiest second sale. Counting delivery apps as a sixth system, 84% of open New York City food-serving places (no bars) show at least one system and 69% two or more; for 11% of places, a delivery app is the only system we see. More on restaurant delivery platforms.
Share of open New York City eating and drinking places with recent reviews.
Show the data as a table
Five systems: systems seen per place. Share of open New York City eating and drinking places with recent reviews.
| Share | |
|---|---|
| None seen | 30% |
| One system | 27% |
| Two systems | 25% |
| Three systems | 13% |
| Four systems | 4.3% |
| All five | 0.8% |
Share of open food-serving places (no bars) with recent reviews in the five boroughs.
Show the data as a table
Six systems: delivery apps included. Share of open food-serving places (no bars) with recent reviews in the five boroughs.
| Share | |
|---|---|
| None seen | 16% |
| One system | 15% |
| Two systems | 28% |
| Three systems | 24% |
| Four systems | 12% |
| Five systems | 4.2% |
| All six | 0.9% |
DashLeads
The shares are public. The restaurant lists are the product.
- Every restaurant in the city with its detected POS, reservations, online ordering, loyalty and rewards vendors
- Filter by gap: restaurants on a rival's system, or with no system in your slot
- Views by borough, city and state
- Export the list to your CRM
We walk you through your city and your slot.
What each system tells a seller
POS: which checkout runs the venue. The POS holds the menu, the prices and often the loyalty programme, so it decides which integrations, ordering partners and offers are possible. In New York City 44% of places show their POS; Toast runs 40% of them and Square 27%, and the menu picks one: bars lean to Toast, cafes to Square. In London, Amsterdam and Sydney the POS shows in public less often, and the field is more local: Toast, Zonal and Square in London, Lightspeed, MplusKASSA and Tebi in Amsterdam, Square, Redcat and Abacus in Sydney. Restaurant POS.
Reservations: who takes bookings online. Price decides which restaurants book through a platform: across six European cities, 2.8% of table-service restaurants under EUR 15 per person book through one, against 85% at EUR 60 and up. Each restaurant carries every booking platform we find for it, marketplace or own-website software, so a rep sees whether a venue is on one system, several or none. Restaurant reservations.
Online ordering: the venue's own channel. Its website, its POS vendor's ordering page or an ordering app it runs itself, kept apart from a storefront run by a delivery marketplace. A venue with its own ordering is a more digital operator, and usually a better fit for integrations, promotions and payments. Restaurant online ordering.
Loyalty, rewards and discounts: who pays the guest to come back. Loyalty is the restaurant's own programme, often the POS vendor's; rewards and discounts are the card-linked networks and deal apps that list it. New York City sells on cards (Bilt, inKind, Upside), Sydney on deals (EatClub), Amsterdam on one venue app (Piggy). Restaurant loyalty and rewards and discounts.
Who leads POS in each state
US maps compare vendors among the venues we detect on their public directories and catalogues; they show who leads where, not a share of all restaurants in a state. The state view counts directory listings matched to eating and drinking places statewide; the New York City figures come from restaurant-level detection. That is why Toast leads the city while Square narrowly leads New York State overall.
Share of venues we detect in the state.Directory listings matched to eating and drinking places in our US base; match coverage differs by vendor (Toast 73% of listings, Square 49%), so Toast is if anything understated. The state view counts listings statewide; New York City figures come from restaurant-level detection, which is why Toast leads the city while Square leads New York State overall.
Show the data as a table
The leading POS vendor per state among Toast, Square and Clover venues. Share of venues we detect in the state.
| State | Leads | Second |
|---|---|---|
| Alabama | Square 51% | Toast 40% |
| Alaska | Square 65% | Toast 20% |
| Arizona | Square 46% (narrow lead) | Toast 42% |
| Arkansas | Square 59% | Toast 32% |
| California | Square 45% (narrow lead) | Toast 40% |
| Colorado | Toast 45% (narrow lead) | Square 42% |
| Connecticut | Toast 44% (narrow lead) | Square 35% |
| Delaware | Toast 56% | Square 32% |
| District of Columbia | Toast 55% | Square 37% |
| Florida | Toast 45% (narrow lead) | Square 41% |
| Georgia | Square 44% (narrow lead) | Toast 42% |
| Hawaii | Square 47% | Toast 30% |
| Idaho | Square 59% | Toast 34% |
| Illinois | Toast 49% (narrow lead) | Square 40% |
| Indiana | Square 50% | Toast 39% |
| Iowa | Square 55% | Toast 37% |
| Kansas | Square 53% | Toast 38% |
| Kentucky | Square 48% (narrow lead) | Toast 43% |
| Louisiana | Square 44% (narrow lead) | Toast 41% |
| Maine | Square 46% (narrow lead) | Toast 45% |
| Maryland | Toast 51% | Square 36% |
| Massachusetts | Toast 56% | Square 36% |
| Michigan | Toast 46% (narrow lead) | Square 42% |
| Minnesota | Toast 49% (narrow lead) | Square 41% |
| Mississippi | Square 52% | Toast 39% |
| Missouri | Square 55% | Toast 35% |
| Montana | Square 56% | Toast 38% |
| Nebraska | Toast 44% (level) | Square 44% |
| Nevada | Toast 45% (narrow lead) | Square 40% |
| New Hampshire | Toast 54% | Square 39% |
| New Jersey | Square 40% (narrow lead) | Toast 39% |
| New Mexico | Square 61% | Toast 29% |
| New York | Square 45% (narrow lead) | Toast 43% |
| North Carolina | Square 49% (narrow lead) | Toast 40% |
| North Dakota | Square 47% (narrow lead) | Toast 43% |
| Ohio | Toast 47% (narrow lead) | Square 41% |
| Oklahoma | Square 57% | Toast 35% |
| Oregon | Square 63% | Toast 27% |
| Pennsylvania | Square 47% (narrow lead) | Toast 42% |
| Rhode Island | Toast 52% | Square 41% |
| South Carolina | Toast 43% (level) | Square 43% |
| South Dakota | Square 55% | Toast 37% |
| Tennessee | Square 51% | Toast 38% |
| Texas | Square 48% (narrow lead) | Toast 40% |
| Utah | Square 51% | Toast 41% |
| Vermont | Square 61% | Toast 34% |
| Virginia | Toast 44% (level) | Square 44% |
| Washington | Square 51% | Toast 34% |
| West Virginia | Square 59% | Toast 31% |
| Wisconsin | Toast 45% (narrow lead) | Square 44% |
| Wyoming | Square 54% | Toast 39% |
POS by borough
Manhattan shows the most POS evidence; the Bronx the least. The borough pages of New York City break every system down the same way.
Share of open eating and drinking places with recent reviews in the borough.
Show the data as a table
Where POS is most visible in New York City. Share of open eating and drinking places with recent reviews in the borough.
| Borough | Share |
|---|---|
| Bronx | 30% |
| Brooklyn | 43% |
| Manhattan | 53% |
| Queens | 36% |
| Staten Island | 37% |
The gap to sell into
71% of New York City places with a POS seen show no loyalty programme in public data.
Share of open New York City eating and drinking places with recent reviews and a POS vendor seen.
Every gap below is a place that runs a POS and shows nothing in the other slot. A restaurant that already pays for software is easier to sell to than one that runs on paper, and the gap tells you which slot is open.
Each bar on its own base, named under its label: open New York City places with recent reviews and a POS seen.
Show the data as a table
What POS restaurants do not show. Each bar on its own base, named under its label: open New York City places with recent reviews and a POS seen.
| Share | |
|---|---|
| No rewards seen | 82% |
| No loyalty seen | 71% |
| No reservations seen | 59% |
| No loyalty and no rewards seen | 58% |
| No online ordering seen | 30% |
Every page, by system, vendor and market
Frequently asked questions
What is the most used POS system for restaurants?
In New York City it is Toast: 40% of places with a POS seen run it, ahead of Square at 27% and Clover at 9.7%.
What is the most used platform for restaurant reservations?
In New York City, Resy: 55% of places that take table bookings use it, and 46% use OpenTable. Across US restaurants that take online bookings on OpenTable, Resy, SevenRooms, Tock, Toast Tables or Yelp, OpenTable is larger.
How many restaurants use more than one system?
43% of open New York City eating and drinking places with recent reviews show two or more of the five systems.
Does POS here mean point-of-sale materials?
No. On these pages POS means the point-of-sale system: the checkout software. For posters, menus and fridges in the venue, see POS material detection.
Which markets are covered?
POS, online ordering, loyalty and rewards for New York City, London, Amsterdam, Sydney, Melbourne and three New Zealand cities; reservations for those plus Paris, Barcelona, Milan, Berlin and Singapore; state maps for the United States. New markets follow demand.
How do I get the data?
As a list of venues with their systems, next to the outlet profile, for the city or territory you sell into. Ask for a sample on the demo page.
Who is winning restaurant technology?
In New York City, Toast leads POS (40% of places with a POS seen), Resy leads table booking (55% of table-booking places) and Toast Online Ordering leads ordering software in use (23%).
What share of restaurants have no loyalty program?
71% of New York City places with a POS seen show no loyalty programme in public data.
For sales leaders: the business case
One shared list of every venue and its systems helps a sales leader in three ways.
- The right pitch per venue. A rep walks in knowing the POS, booking, ordering and loyalty set-up, not guessing it.
- Open ground first. Venues with no system found in your slot, or on a closed platform, go to the top of the list.
- Territories by fit. Count the venues on each system per area, so targets follow where your product fits.