
Restaurant delivery apps: who lists the most restaurants?
We track restaurant listings on 100+ delivery platforms in 60+ countries. In New York City, Uber Eats lists 62% of open food-serving places (no bars) with recent reviews, DoorDash 59% and Grubhub 60%; 74% are on at least one. Below: how much the apps overlap, which places each one lists, and what delivery restaurants run next to them.
Vendors we track at every restaurant












Delivery platforms in 60+ countries
We track restaurant listings on 100+ delivery platforms in 60+ countries, from Uber Eats, DoorDash and Deliveroo to Wolt, Glovo, Grab, foodpanda and talabat. The map shows the platform with the most restaurant listings in each country; New York City, where we read each restaurant against five other systems, follows below.
Share of restaurant listings on delivery apps: each app's share of the open restaurant storefronts on the delivery apps we track in the country. A restaurant on three apps counts three times, so this is not a share of restaurants, orders or sales, and it is not comparable with the city figures on this page.
Uber Eats, Wolt and Grab lead the most countries. On listings, DoorDash has a narrow lead over Uber Eats in the United States; Deliveroo leads Just Eat in the UK. Stripes mark a narrow lead or a level race.
Share of open restaurant storefronts on the tracked delivery apps in the country.
Show the data as a table
The delivery app with the most restaurant listings, by country. Share of open restaurant storefronts on the tracked delivery apps in the country.
| Country | Leads | Second |
|---|---|---|
| Australia | Uber Eats 64% | DoorDash 36% |
| Austria | foodora 52% (narrow lead) | Lieferando 48% |
| Belgium | Deliveroo 41% | Takeaway.com 30% |
| Brazil | not shown: one app tracked | -- |
| Bulgaria | Glovo 53% | Takeaway.com 47% |
| Cambodia | Grab 57% | foodpanda 43% |
| Canada | Uber Eats 43% | DoorDash 29% |
| Chile | PedidosYa 40% | Rappi and Uber Eats (level) 30% |
| Czechia | Wolt 50% (level) | foodora 50% |
| Denmark | not shown: incomplete data | -- |
| Finland | Wolt 64% | foodora 36% |
| France | Uber Eats 56% | Deliveroo 44% |
| Germany | Lieferando 45% | Uber Eats 28% |
| Greece | efood 58% | Wolt 42% |
| Hong Kong | not shown: one app tracked | -- |
| Hungary | Wolt 51% (narrow lead) | foodora 49% |
| Indonesia | GoFood 59% | ShopeeFood 25% |
| Ireland | Just Eat 39% (narrow lead) | Deliveroo 38% |
| Italy | Deliveroo 49% | Glovo 28% |
| Jordan | talabat 76% | Careem 24% |
| Kazakhstan | Wolt 40% | Yandex Eats 35% |
| Kenya | Glovo 43% | Uber Eats 33% |
| Luxembourg | Wolt 92% | Takeaway.com 7.7% |
| Malaysia | Grab 55% | ShopeeFood 23% |
| Netherlands | Thuisbezorgd 61% | Uber Eats 39% |
| New Zealand | Uber Eats 53% | DoorDash 36% |
| Norway | Wolt 54% | foodora 46% |
| Oman | not shown: one app tracked | -- |
| Pakistan | not shown: one app tracked | -- |
| Philippines | Grab 57% | foodpanda 43% |
| Poland | Pyszne.pl 32% (narrow lead) | Glovo 29% |
| Portugal | Uber Eats 51% | Glovo 31% |
| Qatar | talabat 76% | Deliveroo 24% |
| Romania | Glovo 58% | Wolt 42% |
| Saudi Arabia | Jahez 59% | HungerStation 41% |
| Singapore | Grab 39% (narrow lead) | foodpanda 37% |
| South Africa | Uber Eats 52% (narrow lead) | Mr D Food 48% |
| Spain | Glovo 37% (level) | Uber Eats 37% |
| Sweden | foodora 47% | Wolt 28% |
| Switzerland | Uber Eats 46% (narrow lead) | Just Eat 44% |
| Taiwan | Uber Eats 66% | foodpanda 34% |
| Thailand | LINE MAN 62% | Grab 27% |
| Turkey | Yemeksepeti 68% | Trendyol Go 32% |
| United Arab Emirates | talabat 47% | Noon Food 24% |
| United Kingdom | Deliveroo 41% | Just Eat 30% |
| United States of America | DoorDash 40% (narrow lead) | Uber Eats 37% |
| Vietnam | ShopeeFood 48% | Grab 39% |
New York City: delivery apps by listings
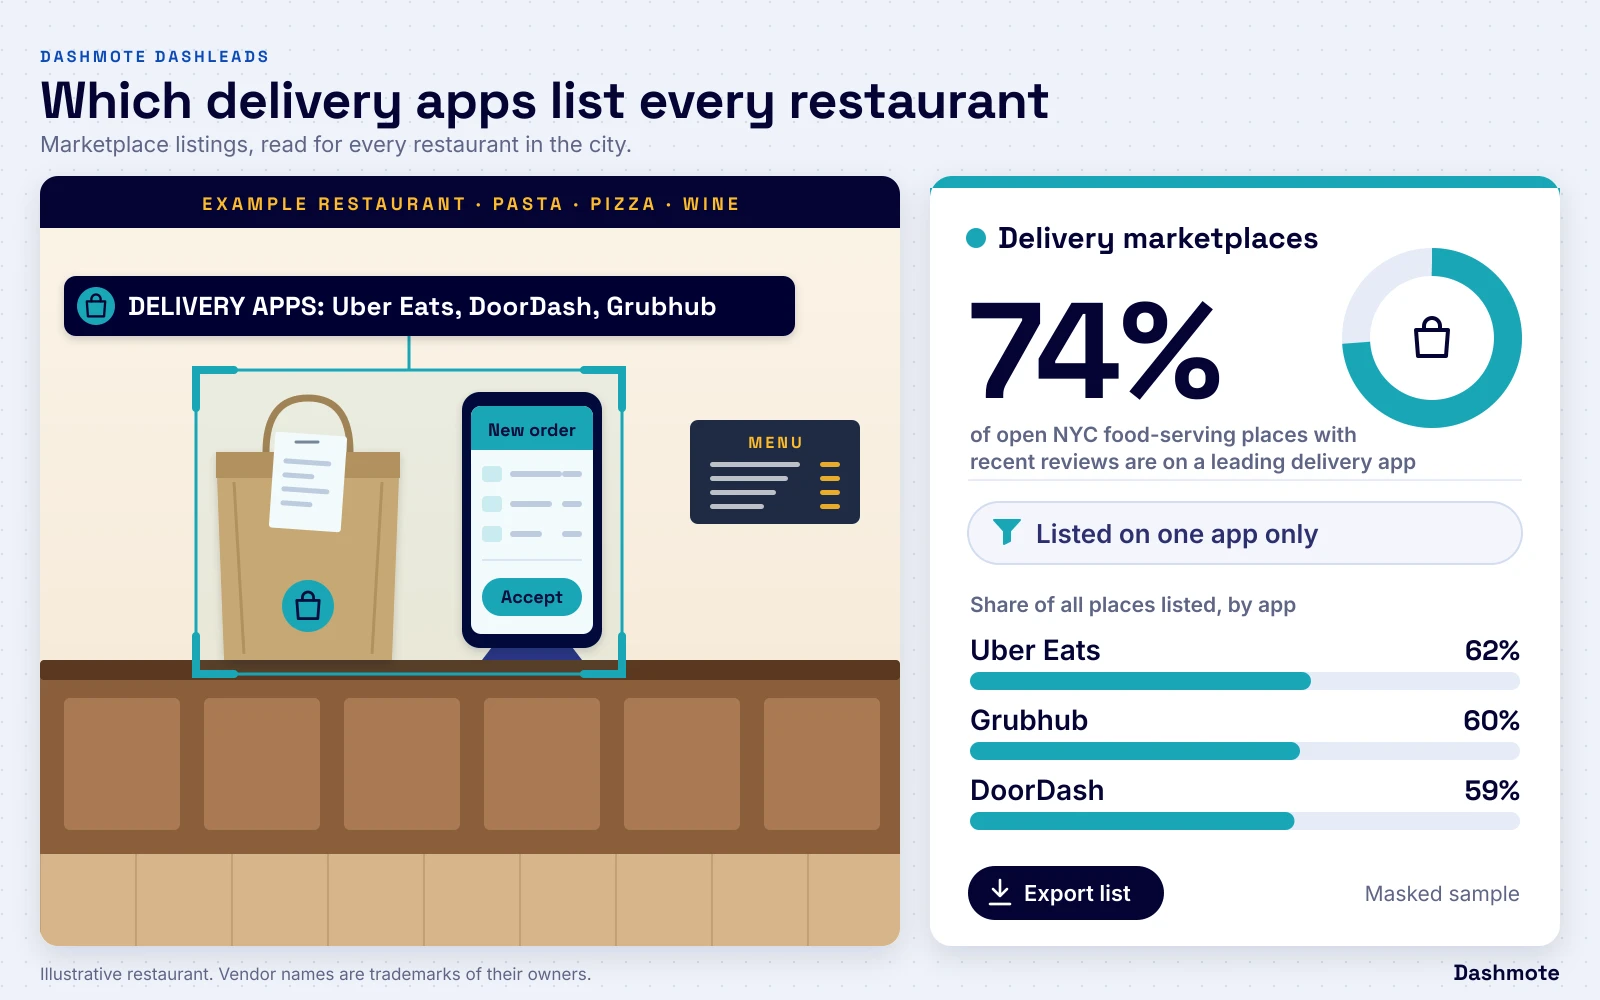
74% of open New York City food-serving places (no bars) with recent reviews are listed on a leading delivery app. Uber Eats, Grubhub and DoorDash each list between 59% and 62% of these places, within 3 points of each other. A place is listed when it is matched to an open store on the app, or the app is named on its own Google listing. Listed is not selling, and nothing here counts orders: these are not market shares. DoorDash Storefront is in online ordering; DoorDash here means the DoorDash marketplace app.
83% of delivery-listed New York City places are on two or more leading apps
58% of delivery-listed New York City places show no first-party ordering
93% of New York City chain outlets are on a delivery app
Share of open New York City food-serving places (no bars) with recent reviews.
Show the data as a table
Which delivery apps list the most New York City places. Share of open New York City food-serving places (no bars) with recent reviews.
| Share | |
|---|---|
| Uber Eats | 62% |
| Grubhub | 60% |
| DoorDash | 59% |
DashLeads
The shares are public. The restaurant lists are the product.
- Every restaurant in the city with its detected POS, reservations, online ordering, loyalty and rewards vendors
- Filter by gap: restaurants on a rival's system, or with no system in your slot
- Views by borough, city and state
- Export the list to your CRM
We walk you through your city and your slot.
One app, or all of them
Most delivery restaurants are on more than one app: 83% of delivery-listed places are on two or more of the leading three, and only 17% on one. A restaurant on one app only is the easiest to win for a second app, and the hardest to make exclusive for a rival.
Share of open New York City food-serving places (no bars) with recent reviews listed on at least one leading delivery marketplace.
Show the data as a table
Delivery-listed places by how many leading apps list them. Share of open New York City food-serving places (no bars) with recent reviews listed on at least one leading delivery marketplace.
| Share | |
|---|---|
| On one leading app only | 17% |
| On two or more | 83% |
| On every leading app | 61% |
How much the apps overlap
Read across: the share of one app's places that the other app also lists. Four in five places on any one app are on each of the others.
Share of open food-serving places (no bars) with recent reviews listed on the row marketplace.
Show the data as a table
Places on one app that the other apps also list. Share of open food-serving places (no bars) with recent reviews listed on the row marketplace.
| Uber Eats | Grubhub | DoorDash | |
|---|---|---|---|
| Uber Eats | -- | 83% | 82% |
| Grubhub | 86% | -- | 83% |
| DoorDash | 86% | 84% | -- |
On one app only
The share of delivery-listed places that only one of the three leading apps lists. A place may still sell on a niche app or its own site.
Share of open New York City food-serving places (no bars) with recent reviews listed on at least one leading delivery marketplace.
Show the data as a table
Delivery-listed places on only one of the three leading apps. Share of open New York City food-serving places (no bars) with recent reviews listed on at least one leading delivery marketplace.
| Share | |
|---|---|
| Uber Eats | 6.5% |
| DoorDash | 5.5% |
| Grubhub | 5.2% |
Delivery by borough
Staten Island has the highest share of places on a delivery app. Uber Eats leads Brooklyn, Queens and the Bronx; Grubhub leads Manhattan; DoorDash leads Staten Island.
Share of open food-serving places (no bars) with recent reviews in the borough.
Show the data as a table
Where New York City places are most often on a delivery app. Share of open food-serving places (no bars) with recent reviews in the borough.
| Borough | Share |
|---|---|
| Bronx | 73% |
| Brooklyn | 73% |
| Manhattan | 75% |
| Queens | 74% |
| Staten Island | 79% |
The leading app in each borough
The app that lists the most places in each borough, with its share; stripes mark a narrow lead or a level race.
Share of open food-serving places (no bars) with recent reviews in the borough.
Show the data as a table
The app that lists the most places in each borough. Share of open food-serving places (no bars) with recent reviews in the borough.
| Borough | Leads | Second |
|---|---|---|
| Bronx | Uber Eats 65% | Grubhub 59% |
| Brooklyn | Uber Eats 60% | DoorDash and Grubhub (level) 58% |
| Manhattan | Grubhub 63% | DoorDash and Uber Eats (level) 61% |
| Queens | Uber Eats 64% | DoorDash 58% |
| Staten Island | DoorDash 69% | Uber Eats and Grubhub (level) 63% |
Pizza, fast food and Italian live on delivery
Fast food and pizza places are the most often on delivery, delis the least. Grubhub leads delis, pizza places and Mexican places; Uber Eats leads coffee shops, general restaurants and Chinese places. Chains are on delivery far more often than independents (93% of chain outlets against 68% of independents), because head offices sign the apps for every outlet.
Share of open food-serving places (no bars) with recent reviews of each kind.
Show the data as a table
Which kinds of New York City places each app lists. Share of open food-serving places (no bars) with recent reviews of each kind.
| Uber Eats | Grubhub | DoorDash | |
|---|---|---|---|
| Pizza places | 72% | 78% | 69% |
| Fast food | 82% | 80% | 82% |
| Italian restaurants | 59% | 67% | 62% |
| Mexican restaurants | 68% | 71% | 63% |
| Coffee shops | 55% | 51% | 54% |
| Chinese restaurants | 50% | 45% | 42% |
| Cafes | 47% | 46% | 47% |
| Restaurants (general) | 59% | 54% | 55% |
| Delis | 39% | 41% | 39% |
Delivery by price
Places at $20 to $30 per person are the most often on a delivery app; the share is lowest at $50 and up.
Share of open food-serving places (no bars) with recent reviews of each kind.
Show the data as a table
New York City places on a delivery app, by price per person. Share of open food-serving places (no bars) with recent reviews of each kind.
| Share | |
|---|---|
| Under $10 | 65% |
| $10 to $20 | 82% |
| $20 to $30 | 85% |
| $30 to $50 | 75% |
| $50 and up | 46% |
Delivery and the other five systems
Places that show POS, online ordering, loyalty and rewards and discounts are more often on delivery than places without them; for reservations there is no such lift.
Share of open New York City food-serving places (no bars) with recent reviews listed on a leading delivery app, among places with and without each system seen.
Show the data as a table
Places on a delivery app, with and without each system. Share of open New York City food-serving places (no bars) with recent reviews listed on a leading delivery app, among places with and without each system seen.
| With the system seen | Without it | |
|---|---|---|
| Online ordering | 94% | 50% |
| Loyalty | 92% | 70% |
| POS | 84% | 67% |
| Rewards and discounts | 83% | 73% |
| Reservations | 72% | 75% |
The whitespace for ordering vendors
58% of New York City places on a delivery app show no first-party ordering software in public data.
Share of open New York City food-serving places (no bars) with recent reviews listed on a leading delivery marketplace.
30% show no online ordering of any kind, not even a marketplace-run storefront. Every one is a restaurant already selling delivery through an app that pays commission on each order.
Share of open New York City food-serving places (no bars) with recent reviews listed on a leading delivery marketplace.
Show the data as a table
What delivery-listed places do not show. Share of open New York City food-serving places (no bars) with recent reviews listed on a leading delivery marketplace.
| Share | |
|---|---|
| No POS seen | 50% |
| No reservations seen | 86% |
| No online ordering seen | 30% |
| No loyalty seen | 78% |
| No rewards seen | 88% |
Own ordering next to the apps
Among delivery places that do run their own ordering, Toast Online Ordering leads.
Share of delivery-listed open New York City food-serving places (no bars) with recent reviews and first-party ordering software seen.
Show the data as a table
First-party ordering vendors at delivery-listed places. Share of delivery-listed open New York City food-serving places (no bars) with recent reviews and first-party ordering software seen.
| Share | |
|---|---|
| Toast Online Ordering | 27% |
| Slice | 15% |
| Square Online | 11% |
| Sauce | 7.5% |
| ChowNow | 7.4% |
Which POS delivery restaurants run
The share of each POS vendor's places listed on each app. Clover and Chowbus places are on delivery most often, Square places least.
Share of open eating and drinking places with recent reviews with the row's POS seen.
Show the data as a table
POS vendor places listed on each delivery app. Share of open eating and drinking places with recent reviews with the row's POS seen.
| Any leading app | Uber Eats | Grubhub | DoorDash | |
|---|---|---|---|---|
| Toast | 83% | 71% | 67% | 70% |
| Square | 72% | 59% | 59% | 58% |
| Clover | 93% | 83% | 78% | 79% |
| MenuSifu | 87% | 81% | 69% | 72% |
| Chowbus POS | 89% | 83% | 62% | 71% |
London, Amsterdam, Australia and New Zealand
The leading apps differ by country: Deliveroo, Uber Eats and Just Eat in London; Thuisbezorgd and Uber Eats level in Amsterdam; Uber Eats ahead of DoorDash in Australia and New Zealand.
Share of open food-serving places (no bars) with recent reviews in each city.
Show the data as a table
The leading delivery apps by city. Share of open food-serving places (no bars) with recent reviews in each city.
| Share | |
|---|---|
| London: Deliveroo | 51% |
| London: Uber Eats | 46% |
| London: Just Eat | 42% |
| Amsterdam: Thuisbezorgd | 31% |
| Amsterdam: Uber Eats | 31% |
| Sydney: Uber Eats | 65% |
| Sydney: DoorDash | 40% |
| Melbourne: Uber Eats | 64% |
| Melbourne: DoorDash | 46% |
| Auckland: Uber Eats | 59% |
| Auckland: DoorDash | 46% |
| Wellington: Uber Eats | 53% |
| Wellington: DoorDash | 46% |
| Christchurch: Uber Eats | 57% |
| Christchurch: DoorDash | 46% |
Asia: Grab, foodpanda, ShopeeFood, LINE MAN
The Asian cities apply the same rule (open food-serving places with recent reviews) to our own place data rather than the restaurant technology build, so these shares are floors and not like for like with the cities above. Jakarta and Manila rest on thinner evidence, and Manila counts open places with five or more reviews, with no recency rule; in Hong Kong we track foodpanda only, so there is no any-app share.
Share of open food-serving places (no bars) with recent reviews in each city.Asian cities: our own place data, not the restaurant technology build, so shares are floors and not like for like with the other markets.Manila: open places with five or more reviews; no recency rule.
Show the data as a table
The leading delivery apps in eight Asian cities. Share of open food-serving places (no bars) with recent reviews in each city.
| Share | |
|---|---|
| Singapore: foodpanda | 39% |
| Singapore: Grab | 37% |
| Singapore: Deliveroo | 22% |
| Kuala Lumpur: Grab | 39% |
| Kuala Lumpur: foodpanda | 35% |
| Kuala Lumpur: ShopeeFood | 27% |
| Bangkok: LINE MAN | 66% |
| Bangkok: Grab | 44% |
| Bangkok: ShopeeFood | 25% |
| Ho Chi Minh City: ShopeeFood | 36% |
| Ho Chi Minh City: Grab | 34% |
| Ho Chi Minh City: BeFood | 25% |
| Taipei: Uber Eats | 33% |
| Taipei: foodpanda | 13% |
| Jakarta: GoFood | 44% |
| Jakarta: ShopeeFood | 35% |
| Jakarta: Grab | 32% |
| Manila: Grab | 34% |
| Manila: foodpanda | 31% |
| Hong Kong: foodpanda | 63% |
Six systems per place
With delivery counted as a sixth system, 84% of open New York City food-serving places (no bars) show at least one system and 69% two or more; delivery is the only system seen at 11% of places. On the five systems alone the figures are 70% and 43%.
Share of open food-serving places (no bars) with recent reviews in the five boroughs.
Show the data as a table
Systems seen per New York City place, delivery included. Share of open food-serving places (no bars) with recent reviews in the five boroughs.
| Share | |
|---|---|
| None seen | 16% |
| One system | 15% |
| Two systems | 28% |
| Three systems | 24% |
| Four systems | 12% |
| Five systems | 4.2% |
| All six | 0.9% |
Europe: Wolt, Glovo, Deliveroo and the locals
Europe has the most local leaders: Wolt leads Finland, Hungary, Luxembourg and Norway, Deliveroo leads Belgium, Italy and the UK, Uber Eats leads Switzerland, France and Portugal, foodora leads Austria and Sweden, Glovo leads Bulgaria and Romania, Lieferando leads Germany, efood leads Greece, Just Eat leads Ireland, Thuisbezorgd leads the Netherlands, Pyszne.pl leads Poland; Czechia and Spain are level between their two leading apps.
Share of restaurant listings on the tracked delivery apps in the country.
Show the data as a table
Europe: the delivery app with the most restaurant listings. Share of restaurant listings on the tracked delivery apps in the country.
| Country | Leads | Second |
|---|---|---|
| Austria | foodora 52% | Lieferando 48% |
| Belgium | Deliveroo 41% | Takeaway.com 30% |
| Bulgaria | Glovo 53% | Takeaway.com 47% |
| Czechia | Wolt 50% (level) | foodora 50% |
| Finland | Wolt 64% | foodora 36% |
| France | Uber Eats 56% | Deliveroo 44% |
| Germany | Lieferando 45% | Uber Eats 28% |
| Greece | efood 58% | Wolt 42% |
| Hungary | Wolt 51% (narrow lead) | foodora 49% |
| Ireland | Just Eat 39% (narrow lead) | Deliveroo 38% |
| Italy | Deliveroo 49% | Glovo 28% |
| Luxembourg | Wolt 92% | Takeaway.com 7.7% |
| Netherlands | Thuisbezorgd 61% | Uber Eats 39% |
| Norway | Wolt 54% | foodora 46% |
| Poland | Pyszne.pl 32% (narrow lead) | Glovo 29% |
| Portugal | Uber Eats 51% | Glovo 31% |
| Romania | Glovo 58% | Wolt 42% |
| Spain | Glovo 37% (level) | Uber Eats 37% |
| Sweden | foodora 47% | Wolt 28% |
| Switzerland | Uber Eats 46% (narrow lead) | Just Eat 44% |
| Turkey | Yemeksepeti 68% | Trendyol Go 32% |
| United Kingdom | Deliveroo 41% | Just Eat 30% |
Every country we track
Click a column to sort. Shares are of restaurant listings on the delivery apps we track in each country; "on two or more apps" is the share of restaurants on more than one. Multi-homing is not measured where our data cannot link one restaurant across apps.
| Australia | Uber Eats | 64% | DoorDash | 36% | 30% | 2026 data |
|---|---|---|---|---|---|---|
| Austria | foodora | 52% | Lieferando | 48% | 37% | 2026 data |
| Belgium | Deliveroo | 41% | Takeaway.com | 30% | 34% | 2026 data |
| Bulgaria | Glovo | 53% | Takeaway.com | 47% | not measured | 2026 data |
| Cambodia | Grab | 57% | foodpanda | 43% | 18% | 2025 data |
| Canada | Uber Eats | 43% | DoorDash | 29% | 48% | 2026 data |
| Chile | PedidosYa | 40% | Rappi | 30% | 19% | 2026 data |
| Czechia | Wolt (level) | 50% | foodora | 50% | 35% | 2026 data |
| Finland | Wolt | 64% | foodora | 36% | 33% | 2026 data |
| France | Uber Eats | 56% | Deliveroo | 44% | 28% | 2026 data |
| Germany | Lieferando | 45% | Uber Eats | 28% | 38% | 2026 data |
| Greece | efood | 58% | Wolt | 42% | 34% | 2026 data |
| Hungary | Wolt (narrow lead) | 51% | foodora | 49% | 36% | 2026 data |
| Indonesia | GoFood | 59% | ShopeeFood | 25% | 19% | 2025 data |
| Ireland | Just Eat (narrow lead) | 39% | Deliveroo | 38% | 30% | 2026 data |
| Italy | Deliveroo | 49% | Glovo | 28% | 25% | 2026 data |
| Jordan | talabat | 76% | Careem | 24% | 19% | 2026 data |
| Kazakhstan | Wolt | 40% | Yandex Eats | 35% | 22% | 2026 data |
| Kenya | Glovo | 43% | Uber Eats | 33% | 12% | 2026 data |
| Luxembourg | Wolt | 92% | Takeaway.com | 7.7% | not measured | 2026 data |
| Malaysia | Grab | 55% | ShopeeFood | 23% | 23% | 2025 data |
| Netherlands | Thuisbezorgd | 61% | Uber Eats | 39% | 38% | 2026 data |
| New Zealand | Uber Eats | 53% | DoorDash | 36% | 43% | 2025 data |
| Norway | Wolt | 54% | foodora | 46% | 44% | 2026 data |
| Philippines | Grab | 57% | foodpanda | 43% | 30% | 2025 data |
| Poland | Pyszne.pl (narrow lead) | 32% | Glovo | 29% | 31% | 2026 data |
| Portugal | Uber Eats | 51% | Glovo | 31% | 21% | 2026 data |
| Qatar | talabat | 76% | Deliveroo | 24% | 13% | 2026 data |
| Romania | Glovo | 58% | Wolt | 42% | 12% | 2026 data |
| Saudi Arabia | Jahez | 59% | HungerStation | 41% | not measured | 2026 data |
| Singapore | Grab (narrow lead) | 39% | foodpanda | 37% | 46% | 2025 data |
| South Africa | Uber Eats | 52% | Mr D Food | 48% | 27% | 2026 data |
| Spain | Glovo (level) | 37% | Uber Eats | 37% | 22% | 2026 data |
| Sweden | foodora | 47% | Wolt | 28% | 48% | 2026 data |
| Switzerland | Uber Eats (narrow lead) | 46% | Just Eat | 44% | 36% | 2026 data |
| Taiwan | Uber Eats | 66% | foodpanda | 34% | 21% | 2026 data |
| Thailand | LINE MAN | 62% | Grab | 27% | 13% | 2026 data |
| Turkey | Yemeksepeti | 68% | Trendyol Go | 32% | 21% | 2026 data |
| United Arab Emirates | talabat | 47% | Noon Food | 24% | 33% | 2026 data |
| United Kingdom | Deliveroo | 41% | Just Eat | 30% | 40% | 2026 data |
| United States | DoorDash (narrow lead) | 40% | Uber Eats | 37% | 49% | 2026 data |
| Vietnam | ShopeeFood | 48% | Grab | 39% | 22% | 2026 data |
More vendors we track
Vendors with too few public figures for a page of their own, with what we can show. Each one is in the restaurant lists, next to the vendors above.
- Just Eat. A leading delivery app in London. 42% of London places are listed on it.
- Thuisbezorgd. The leading delivery app in Amsterdam, level with Uber Eats. 31% of Amsterdam places are listed on it.
- LINE MAN. The leading delivery app in Bangkok. 66% of Bangkok places in our place data are listed on it.
- BeFood. A delivery app in Ho Chi Minh City. 25% of Ho Chi Minh City places in our place data are listed on it.
- GoFood. The leading delivery app in Jakarta, where our evidence is thinner.
- talabat. The leading delivery app in the Gulf and Jordan. 76% of restaurant listings on delivery apps in Jordan, 76% in Qatar and 47% in the UAE.
How teams use delivery data
- Delivery platforms. Find the restaurants on a rival app only, or on none, by area, kind of place and price.
- Online ordering vendors. Target delivery restaurants with no first-party ordering: they pay commission on orders they could take themselves.
- POS companies. See which delivery integrations your merchants need, app by app.
- Food and drinks brands. Pick the delivery-heavy outlets where a listed product reaches the guest.
Every app we detect
Vendor names and logos are trademarks of their owners. Dashmote is not affiliated with any vendor shown.

Delivery apps we detect
- DoorDash
- Uber Eats
- Grubhub
- Deliveroo
- Just Eat
- Thuisbezorgd
- Grab
- ShopeeFood
- foodpanda
- LINE MAN
- BeFood
- GoFood
- Bolt Food
- Careem
- Getir Locals
- Glovo
- HungerStation
- Jahez
- Lieferando
- Mr D Food
- Noon Food
- PedidosYa
- Pyszne.pl
- Rappi
- SkipTheDishes
- Smood
- Takeaway.com
- Trendyol Go
- Wolt
- Yandex Eats
- Yemeksepeti
- delivereasy
- efood
- foodora
- talabat
Frequently asked questions
Which delivery app lists the most New York City restaurants?
Uber Eats, at 62% of open New York City food-serving places (no bars) with recent reviews, ahead of Grubhub at 60% and DoorDash at 59%. Listings are not orders: this does not say which app wins the most orders.
Is DoorDash Storefront counted here?
No. DoorDash Storefront is online ordering a restaurant runs under its own name, so it is on the online ordering page; DoorDash here means the DoorDash marketplace app.
What does listed on a delivery app mean?
The place is matched to an open store on the app, or the app is named on the place's own Google listing. A listed store can be paused or out of hours, so it is not proof of orders.
Is this market share?
No. It is the share of places each app lists. Nothing here measures orders, sales or commission.
Related reading
For sales leaders: the business case
Knowing which apps list each restaurant turns a delivery strategy into a list.
- Single-app restaurants first. Places on one app only are the easiest second listing, and the most exposed to an exclusive deal.
- Ordering vendors: delivery restaurants with no own ordering pay commission on every order.
- City by city: the leading apps differ in every market, and so does the pitch.