
Restaurant reservations: who leads
Resy leads reservations in New York City at 55% of the places that take table bookings; 27% of open table-service restaurants with recent reviews show a booking platform (any booking vendor, private-event tools included). Below: every vendor's share, where each one leads by borough and country, how the same system looks in other markets, and how sales teams use it.
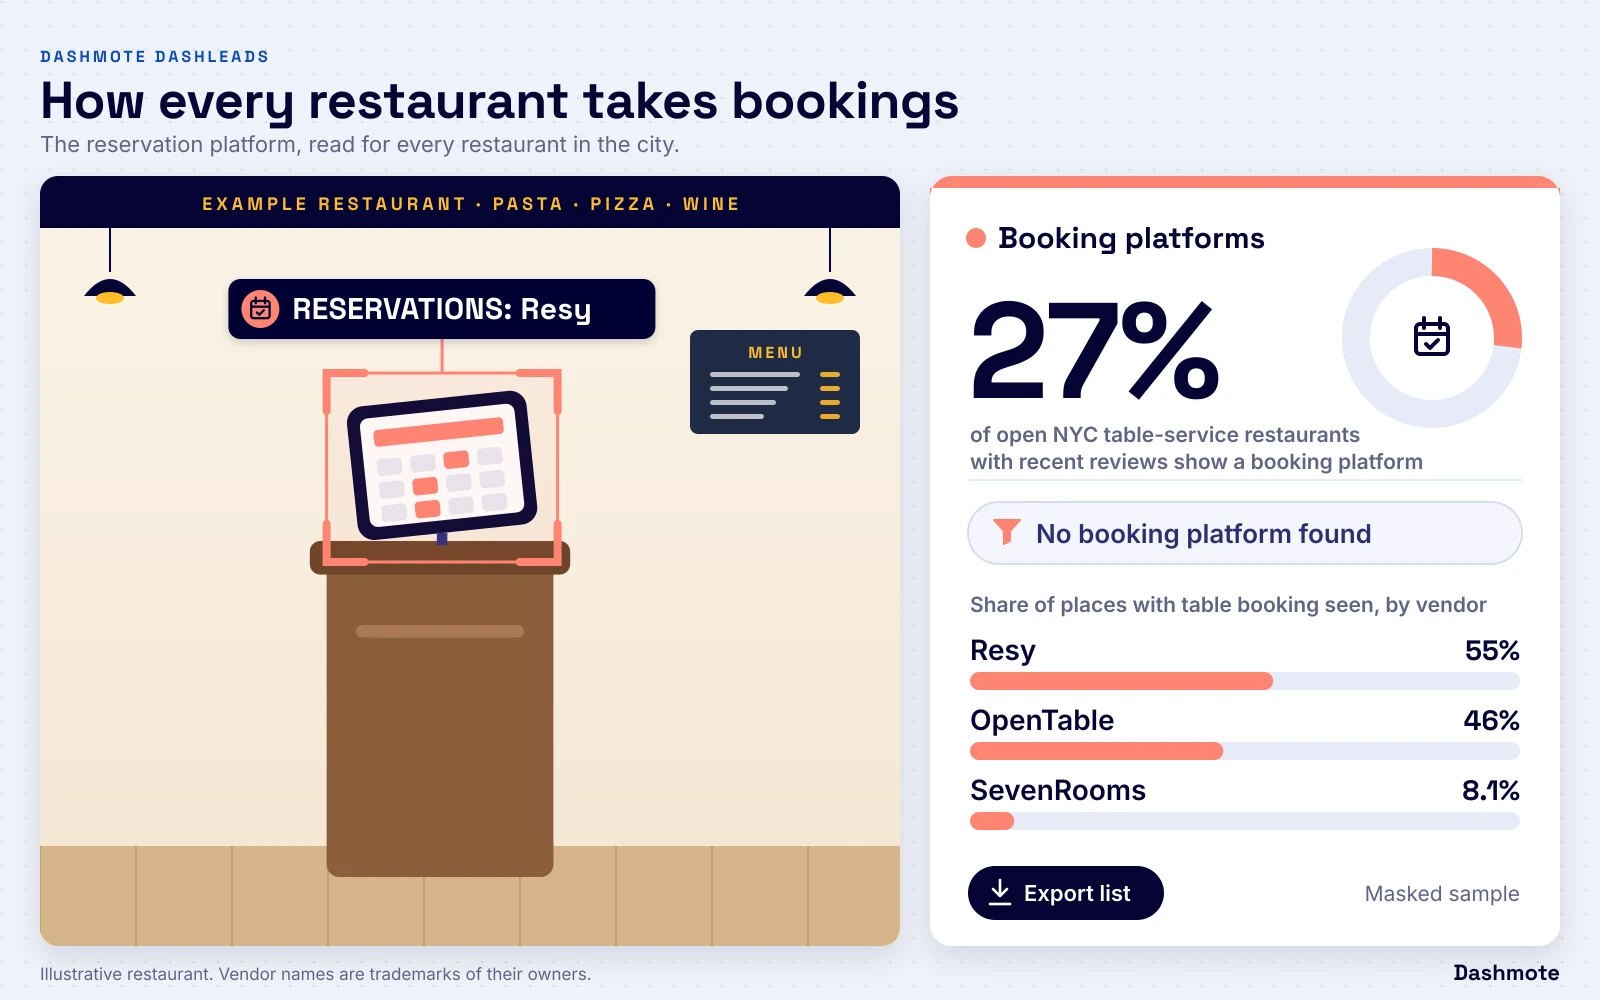
27% of open New York City table-service restaurants with recent reviews show a booking platform (any booking vendor, private-event tools included).
Share of open New York City table-service restaurants with recent reviews.
Also in the data
55% of the places that take table bookings run Resy, the leading vendor
26% of open New York City table-service restaurants have a booking platform confirmed in use
33% of places with a booking platform seen use two or more reservations vendors
Vendors we track at every restaurant











Reservations vendors by share
Shares are of places with the system seen; a place can use several vendors, so shares add to more than 100%.
Share of open New York City table-service restaurants with recent reviews that take table bookings.
Show the data as a table
The leading reservations vendors in New York City. Share of open New York City table-service restaurants with recent reviews that take table bookings.
| Share | |
|---|---|
| Resy | 55% |
| OpenTable | 46% |
| SevenRooms | 8.1% |
| Yelp Guest Manager | 7.6% |
| Dorsia | 2.6% |
| TableAgent | 2.0% |
Price decides who books through a platform
Across six European cities, 2.8% of table-service restaurants under EUR 15 per person book through a platform; at EUR 60 and up, 85% do. The climb is the same in every city, so the best-qualified prospects for a booking platform sit at EUR 30 and up with no platform found.
Reservation data turns that into a list of named restaurants, grouped by booking situation:
- No booking platform found. The new-business list, best sorted by price and cuisine.
- On a competitor only. One rival system and nothing else: the win-back and displacement list.
- Marketplace only. Listed on a diner-side marketplace with no booking tool on its own website: the upsell list for white-label software.
- Several systems. Restaurants juggling several tools: the consolidation pitch.
- Closed platform. Still linking to Quandoo, which stopped accepting new bookings after 30 September 2026: these restaurants must choose a new system now.
Share of open table-service restaurants with recent reviews in each price band in each city.
Show the data as a table
Pricier restaurants book through a platform more. Share of open table-service restaurants with recent reviews in each price band in each city.
| Under EUR 15 | EUR 15 to 30 | EUR 30 to 60 | EUR 60 and up | |
|---|---|---|---|---|
| London | -- | 23% | 62% | 87% |
| Amsterdam | -- | 30% | 74% | 80% |
| Paris | 5.2% | 41% | 77% | 86% |
| Berlin | 4.0% | 27% | 60% | 78% |
| Barcelona | -- | 29% | 65% | 88% |
| Milan | 4.8% | 35% | 65% | 80% |
DashLeads
The shares are public. The restaurant lists are the product.
- Every restaurant in the city with its detected POS, reservations, online ordering, loyalty and rewards vendors
- Filter by gap: restaurants on a rival's system, or with no system in your slot
- Views by borough, city and state
- Export the list to your CRM
We walk you through your city and your slot.
Marketplace or own software, by price
Among the restaurants that do book through a platform, the mix barely moves above EUR 15: own booking software only is the largest group and marketplace only the next, while the share on both grows towards the top end. Under EUR 15 the few restaurants that book online mostly run their own software.
Share of open table-service restaurants with recent reviews and a booking platform seen, in each price band, six cities.
Show the data as a table
How restaurants on a booking platform book, by price per person. Share of open table-service restaurants with recent reviews and a booking platform seen, in each price band, six cities.
| Marketplace only | Both | Own booking software only | |
|---|---|---|---|
| Under EUR 15 | 22% | -- | 73% |
| EUR 15 to 30 | 39% | 18% | 42% |
| EUR 30 to 60 | 35% | 23% | 42% |
| EUR 60 and up | 36% | 28% | 36% |
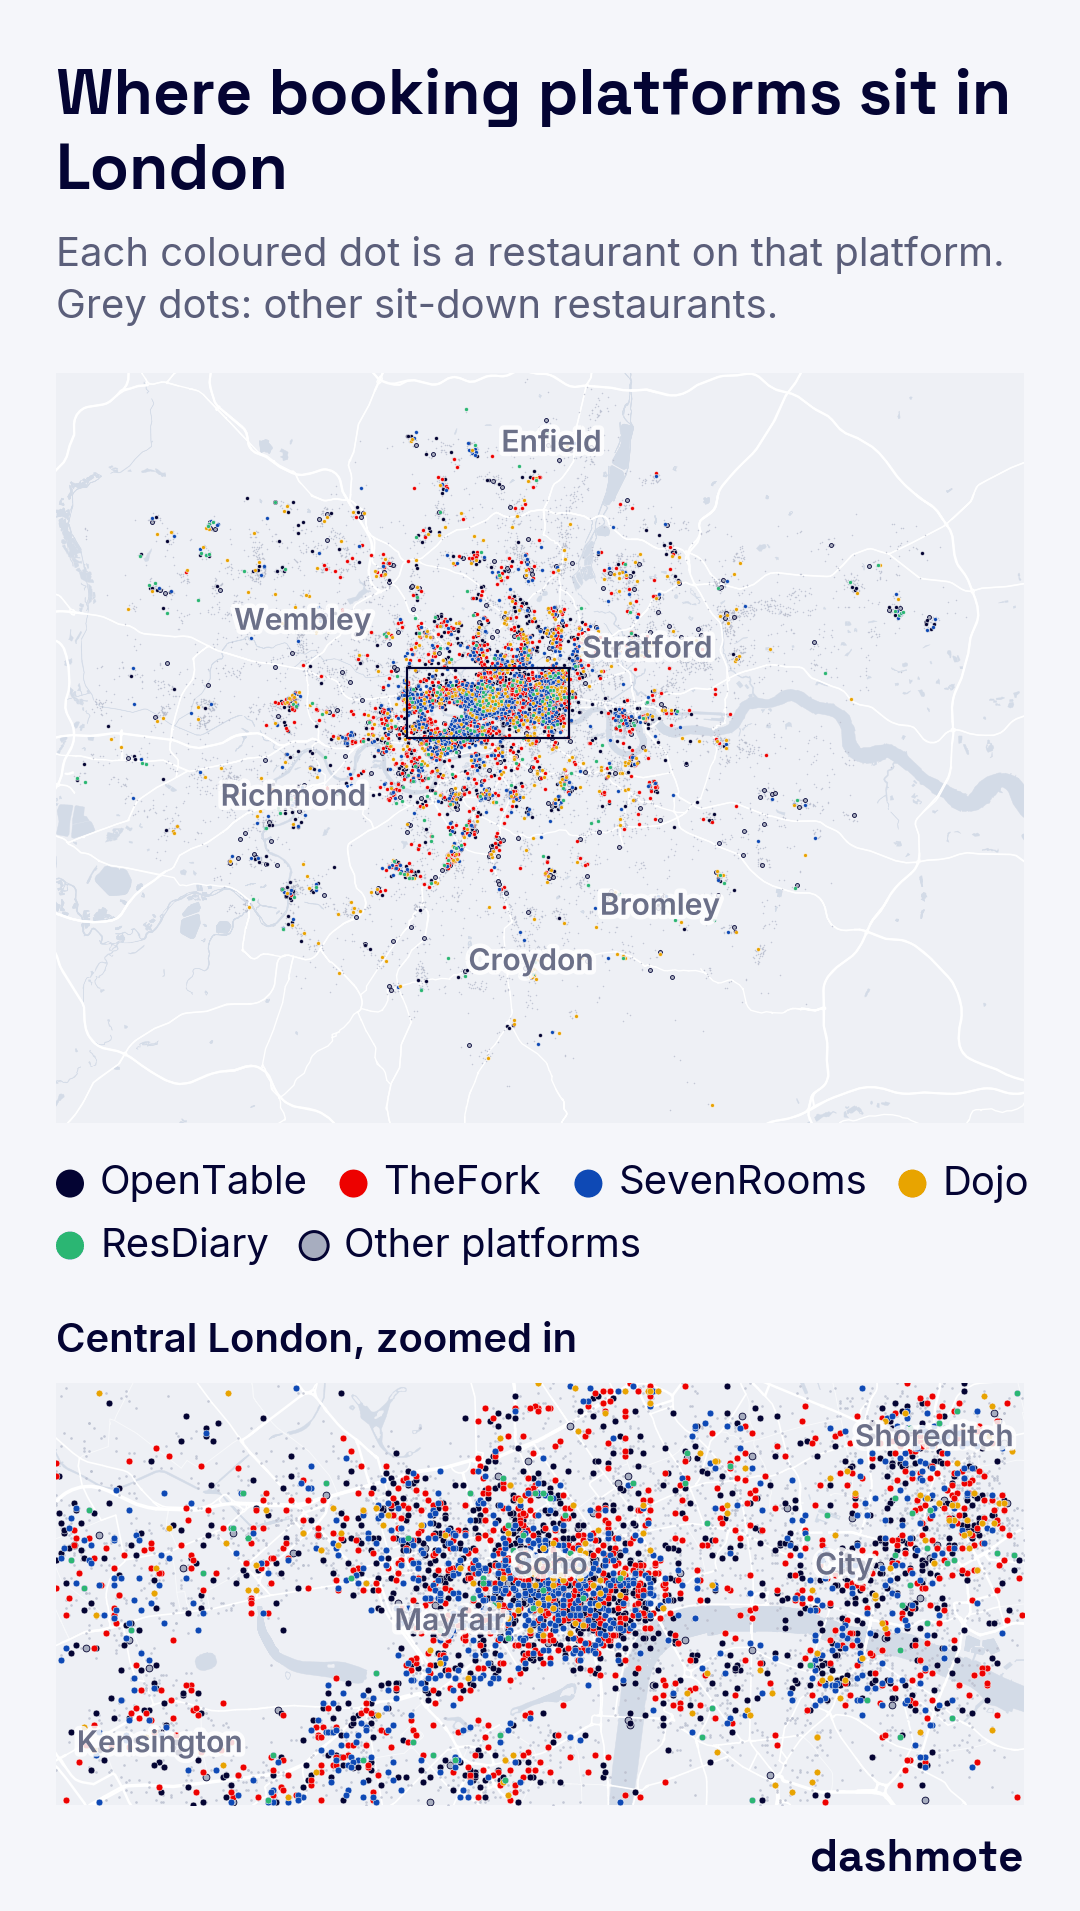
Where booking platforms sit in London
OpenTable is on 44% of London table-service restaurants with a booking platform, TheFork on 37% and SevenRooms on 28%. The platforms crowd into London Soho, Mayfair, the City and Shoreditch; further out, coloured dots thin and most sit-down restaurants show no platform at all.
More on the London booking platforms page.
Top booking platforms in six European cities
TheFork leads among the marketplaces in most cities and OpenTable leads London. In Berlin DISH Reservation is the most common booking tool we found, at 25% of restaurants on a booking platform; TheFork and OpenTable are level at 18%. A restaurant can use several platforms, so the shares overlap; the last column is a share of open table-service restaurants with recent reviews in the city.
| City | TheFork | OpenTable | Leader among the three | Book through a platform |
|---|---|---|---|---|
| London | 37% | 44% | OpenTable leads | 32% |
| Amsterdam | 40% | 4.2% | TheFork leads | 41% |
| Paris | 52% | 8.0% | TheFork leads | 46% |
| Berlin | 18% | 18% | Level | 26% |
| Barcelona | 54% | 12% | TheFork leads | 30% |
| Milan | 69% | 6.1% | TheFork leads | 39% |
Share of open table-service restaurants with recent reviews and a booking platform seen in each city.
Show the data as a table
The top four booking platforms in each city. Share of open table-service restaurants with recent reviews and a booking platform seen in each city.
| Share | |
|---|---|
| London: OpenTable | 44% |
| London: TheFork | 37% |
| London: SevenRooms | 28% |
| London: Dojo Bookings | 12% |
| Amsterdam: TheFork | 40% |
| Amsterdam: Zenchef | 32% |
| Amsterdam: Tebi | 15% |
| Amsterdam: Guestplan | 14% |
| Paris: TheFork | 52% |
| Paris: Zenchef | 34% |
| Paris: uReserve (Uniiti) | 18% |
| Paris: DISH Reservation | 8.7% |
| Berlin: DISH Reservation | 25% |
| Berlin: TheFork | 18% |
| Berlin: OpenTable | 18% |
| Berlin: resmio | 16% |
| Barcelona: TheFork | 54% |
| Barcelona: CoverManager | 32% |
| Barcelona: DISH Reservation | 14% |
| Barcelona: OpenTable | 12% |
| Milan: TheFork | 69% |
| Milan: DISH Reservation | 14% |
| Milan: Plateform | 8.4% |
| Milan: Superb | 7.3% |
TheFork, OpenTable and own booking software
Across the six cities, a large share of the restaurants on a booking platform run their own booking software only, and the two marketplaces overlap far less with each other than with own software.
Share of open table-service restaurants with recent reviews and a booking platform seen in the six cities.
Show the data as a table
TheFork, OpenTable and own booking software, six cities. Share of open table-service restaurants with recent reviews and a booking platform seen in the six cities.
| Share | |
|---|---|
| TheFork only | 24% |
| OpenTable only | 8.9% |
| Own booking software only | 42% |
| TheFork and OpenTable | 4.2% |
| TheFork and Own booking software | 15% |
| OpenTable and Own booking software | 2.8% |
| TheFork and OpenTable and Own booking software | 2.9% |
Own software or marketplace: it depends on the city
- Amsterdam and Berlin: mostly own booking software (73% and 75% of restaurants on a booking platform), Berlin through many small tools.
- Paris: mostly own software, 69% against 56% on a marketplace.
- Milan and London: mostly marketplace (71% and 67%).
- Barcelona: level, 62% on a marketplace and 60% on own software.
On restaurants' own websites, own booking software outnumbers marketplace widgets in every city; where the marketplaces lead, they win through their listings.
Share of open table-service restaurants with recent reviews and a booking platform seen in each city.
Show the data as a table
Marketplace or own booking software, by city. Share of open table-service restaurants with recent reviews and a booking platform seen in each city.
| Marketplace | Own booking software | |
|---|---|---|
| London | 67% | 53% |
| Amsterdam | 43% | 73% |
| Paris | 56% | 69% |
| Berlin | 34% | 75% |
| Barcelona | 62% | 60% |
| Milan | 71% | 52% |
Four numbers per city
Who dominates, the marketplace and own-software split, switching exposure (restaurants on one platform only) and white space (no platform found):
| City | On a marketplace | Own booking software | One platform found | No booking platform found |
|---|---|---|---|---|
| London | 67% | 53% | 69% | 68% |
| Amsterdam | 43% | 73% | 80% | 59% |
| Paris | 56% | 69% | 71% | 54% |
| Berlin | 34% | 75% | 84% | 74% |
| Barcelona | 62% | 60% | 77% | 70% |
| Milan | 71% | 52% | 73% | 61% |
Marketplace, own software and one-platform shares are shares of restaurants on a booking platform; a restaurant can be on a marketplace and own software at once. The last column is a share of all table-service restaurants in the city.
Europe, country by country
With every booking platform we track, Zenchef leads Belgium, Luxembourg and the Netherlands; TheFork leads Italy, Sweden and Switzerland; DISH Reservation leads Austria and Germany; OpenTable leads Ireland. France, Portugal and Spain have no clear leader. In the UK, the three most used booking platforms are OpenTable (31%), ResDiary (26%) and Dojo Bookings (22%). A country is level (striped) where the top two are under 5 points apart.
The country table and the three-platform view are on OpenTable vs TheFork vs Zenchef.
Every platform counts the restaurants bookable online on it, TheFork included. A restaurant on several platforms counts for each, so shares add up to more than 100%. Overlaps with DISH Reservation are minimums.
Share of restaurants bookable online on any platform we track in the country.Platforms count the restaurants bookable on them, TheFork included.
Show the data as a table
The leading booking platform in each country. Share of restaurants bookable online on any platform we track in the country.
| Country | Leads | Second |
|---|---|---|
| Austria | DISH Reservation 41% | TheFork and resmio follow 23%, 20% |
| Belgium | Zenchef 80% | DISH Reservation and TheFork follow 12%, 10% |
| France | Zenchef 37% (level) | DISH Reservation 36% |
| Germany | DISH Reservation 46% | resmio and gastronovi follow 19%, 16% |
| Ireland | OpenTable 58% | ResDiary 39% |
| Italy | TheFork 73% | DISH Reservation 23% |
| Luxembourg | Zenchef 96% | none |
| Netherlands | Zenchef 56% | TheFork 35% |
| Portugal | TheFork 50% (level) | DISH Reservation 48% |
| Spain | DISH Reservation 35% (level) | CoverManager 31% |
| Sweden | TheFork 92% | Zenchef 5.1% |
| Switzerland | TheFork 43% | Zenchef 22% |
| United Kingdom | OpenTable 31% (level) | ResDiary 26% |
How we count bookable restaurants
What the shares measure. Each share is a platform's share of the restaurants that can be booked online on at least one of the booking platforms we track in that market. A restaurant on two platforms counts for both, so shares add up to more than 100%. A listing shows where a restaurant can be booked, not how many bookings it takes, and says nothing about bookings, revenue or contracts.
What counts as bookable.
- OpenTable: a restaurant profile that takes reservations; information-only listings and permanently closed profiles are left out.
- Resy: an active Resy venue.
- SevenRooms: a live SevenRooms venue with online booking switched on.
- Tock: a Tock venue with bookings switched on and dates open for booking.
- Toast Tables: only restaurants that have switched on Toast's online reservations. Restaurants that use Toast Tables only for the host stand or the waitlist are not counted.
- Yelp: a restaurant in Yelp's reservations search with at least one open booking time in the following week.
- TheFork (Europe): only restaurants TheFork marks as bookable that have dates open for booking. Listed-only restaurants are not counted.
- ResDiary (Europe): only restaurants with at least one open time in the next three months; demo and test diaries are left out.
- Zenchef (Europe): active accounts only; a Formitable account that moved to Zenchef counts once, as Zenchef.
- Other European platforms (DISH Reservation, Dojo Bookings, resmio, gastronovi, CoverManager): restaurants whose booking page is live.
What is out of scope. Waitlist-only tools; Yelp listings without an open booking time; Toast Tables without online reservations; restaurants we could not match to a single map listing; US territories; in Europe, the Channel Islands, Monaco and other territories with their own country code. Quandoo is not counted: it stopped accepting new bookings after 30 September 2026.
Coverage. United States: the 50 states and DC; Yelp was read in 60 major metro areas, so its national share is a minimum. Europe: Austria, Belgium, France, Germany, Italy, the Netherlands, Portugal, Spain, Sweden, Switzerland and the United Kingdom, plus Ireland and Luxembourg. Data read in 2026.
Limits. Shares cover the booking tools we could detect, so the true use of online booking is likely higher. SevenRooms and Toast Tables are minimums. DISH Reservation is matched to restaurants by postcode and name, so its overlaps with other platforms are minimums. Shares of 10% and over are rounded to the nearest whole percent, shares under 10% to one decimal.
TheFork, Zenchef and OpenTable in six European cities
Own booking software and marketplaces sit side by side in every city, and many restaurants use both: 29% of Paris restaurants with a booking platform use two or more, 20% in Amsterdam and 31% in London.
The full city-by-city comparison is on Zenchef vs TheFork vs OpenTable.
Share of open table-service restaurants with recent reviews and a booking platform seen in each city.
Show the data as a table
TheFork, Zenchef and OpenTable in six European cities. Share of open table-service restaurants with recent reviews and a booking platform seen in each city.
| TheFork | Zenchef | OpenTable | |
|---|---|---|---|
| London | 37% | -- | 44% |
| Amsterdam | 40% | 32% | 4.2% |
| Paris | 52% | 34% | 8.0% |
| Berlin | 18% | 12% | 18% |
| Barcelona | 54% | -- | 12% |
| Milan | 69% | -- | 6.1% |
Reservations by borough
Manhattan shows the most reservations; the Bronx the least.
Share of open table-service restaurants with recent reviews in the borough.
Show the data as a table
Where reservations is most visible in New York City. Share of open table-service restaurants with recent reviews in the borough.
| Borough | Share |
|---|---|
| Bronx | 5.3% |
| Brooklyn | 20% |
| Manhattan | 49% |
| Queens | 11% |
| Staten Island | 14% |
Singapore
In Singapore, 32% of open sit-down restaurants show a booking platform, and Chope leads at 54% of them.
Share of open Singapore sit-down restaurants with recent reviews and a booking platform seen.
Show the data as a table
Booking platforms in Singapore. Share of open Singapore sit-down restaurants with recent reviews and a booking platform seen.
| Share | |
|---|---|
| Chope | 54% |
| inline | 15% |
| Oddle Reserve | 14% |
| SevenRooms | 14% |
| Eatigo | 10% |
| Hungry Hub | 8.1% |
Seven booking fields per restaurant, next to the outlet profile
| Field | What it tells you | Example values |
|---|---|---|
| Booking systems | Every booking system found | TheFork; Zenchef |
| Found via | Where each system was found | Map listing, marketplace, website |
| Platform type | What kind of system it is | Marketplace, own-website booking software, events and groups |
| Systems found | How many table-booking systems | One, several, events only, none |
| Closed platform | Still links to a closed platform (Quandoo) | Yes, no |
| White space score | How open the restaurant is to a new booking system | High, medium, low |
| Outlet profile | Who the restaurant is | Cuisine, price per person, neighbourhood, chain or independent, rating, reviews |
We deliver it as a list or CSV export. Send us your customer list and we mark the restaurants you already serve, so the rest is prospect territory.
Worked example: a week of prospecting
Sample rows with generic names, not real restaurants.
A rep selling own-website booking software in one city starts from the restaurants at EUR 30 and up per person with a solid review count:
| Restaurant | Cuisine | Booking systems found | Found via | Systems found | Next step |
|---|---|---|---|---|---|
| Venue A | Italian | None | none | None | New business: book a demo |
| Venue B | Steakhouse | Marketplace | Marketplace | One | Add own-website booking |
| Venue C | Japanese | Own software | Website | One | Competitor customer: note renewal |
| Venue D | French | Marketplace; own software | Map listing, website | Several | Consolidation pitch |
| Venue E | Tapas | Quandoo (stopped accepting new bookings) | Map listing | None | No live booking platform: call this week |
Venue E is the warmest call: its booking platform has closed, so it must choose a new system now.
What the shares cover
- Table-service restaurants; bars, cafes, coffee shops, takeaway and fast food are excluded from the European city shares.
- Shares cover the booking tools we could detect, so the true use of online booking is likely higher.
- A listing shows where a restaurant can be booked, not how many bookings it takes.
Reservations vendor pages
More vendors we track
Vendors with too few public figures for a page of their own, with what we can show. Each one is in the restaurant lists, next to the vendors above.
- Quandoo. A booking marketplace that stopped accepting new bookings after 30 September 2026. Restaurants still linking to it are on the closed-platform list.
- Dojo Bookings. Booking software restaurants run on their own website, strongest in the UK. 22% of UK restaurants on a booking platform we track.
- gastronovi. Booking software in German-speaking countries. 16% of German and 16% of Swiss restaurants on a booking platform we track.
- Tripleseat. Software for private dining and group events at restaurants and venues, rather than table booking. 12% of open New York City table-service restaurants with recent reviews and a reservations vendor seen (private-event tools included).
Platforms we track: marketplaces, booking software and events
The booking platforms we found in New York City, the US, Europe and Singapore, grouped by type. Website-builder booking forms such as Wix are not counted as platforms.
Vendor names and logos are trademarks of their owners. Dashmote is not affiliated with any vendor shown.










Marketplaces and booking apps
- OpenTable
- Resy
- TheFork
- Tock
- Chope
- TableAgent
- Privateaser
- Foodhutz
- Dish Cult
- BooknBook
- eet.nu
- AutoReserve
- Eatigo
Restaurant booking software
- SevenRooms
- Zenchef
- Formitable
- CoverManager
- DISH Reservation
- uReserve by Uniiti
- Dojo Bookings
- resmio
- ResDiary
- Foodamigos
- Tebi
- OKO
- Guestplan
- Restoo
- Plateform
- Superb
- LOR
- resOS
- gastronovi
- Favourite Table
- ChefOnline
- Last.app
- Toast Tables
- Yelp Guest Manager
- NowBookIt
- Obee
- inline
- Oddle Reserve
- Tableo
- Guestonline
- Lightspeed
- Eat App
- Octotable
- EasyTable
- aleno
- TableCheck
- Tablein
- Eveve
- SumUp
- UMAI
Events and group bookings
- Tripleseat
- Perfect Venue
- RestauRent
- DesignMyNight
- Bookingshake
- FareHarbor
No longer taking bookings
- Quandoo (stopped accepting new bookings after 30 September 2026)
Frequently asked questions
Is Resy or OpenTable bigger?
In New York City, Resy: 55% of table-booking places use it against 46% for OpenTable. Across the US OpenTable is larger, at 52% of US restaurants that take online bookings on OpenTable, Resy, SevenRooms, Tock, Toast Tables or Yelp.
How do I find out which reservation system a restaurant uses?
We combine several public sources per restaurant (its map listing, its website and the booking platforms) and match each booking system to the venue, so a restaurant counts once however many places show it.
How many restaurants book through a platform?
In six European cities: Paris 46%, Barcelona 30%, Amsterdam 41%, Milan 39%, Berlin 26% and London 32% of table-service restaurants. In New York City, 27% of open table-service restaurants with recent reviews.
What is the difference between a platform listing and a booking taken through it?
A listing means the restaurant can be booked on that platform; it does not tell you how many bookings it takes there. The data shows where a restaurant is bookable, not booking volumes, availability or commissions.
Can I get a list of restaurants with no booking platform?
Yes: we deliver them as a list or export, marked as no system found. Detection can miss a hidden booking link, so treat it as the restaurants where no system was visible, and qualify on the first call.
Can I match it to my CRM?
Yes: send us your customer list and we mark the restaurants you already serve, so the rest of the list is prospects.
What is the most used platform for restaurant reservations?
In New York City, Resy (55% of places that take table bookings). Across US restaurants that take online bookings on OpenTable, Resy, SevenRooms, Tock, Toast Tables or Yelp, OpenTable (52%).
Who are OpenTable's competitors?
In New York City, among places that take table bookings: Resy (55%), SevenRooms (8.1%) and Yelp Guest Manager (7.6%); across the US, Resy, SevenRooms, Tock, Toast Tables and Yelp.
Related reading
For sales leaders: the business case
A shared list of every restaurant and its booking system helps a sales leader in three ways.
- Territories sized on the open market: restaurants with no booking platform, on a competitor only, or on several systems, per city.
- Faster win-backs: restaurants on a closed or rival platform flagged by name.
- One list for the whole team, delivered as a list or CSV export. See pricing.