Five systems, one restaurant: the New York City restaurant tech stack
Which POS, booking, online ordering, loyalty and rewards systems New York City restaurants run, who leads each one, and where the stack has gaps.
Key findings
- 43% of open New York City eating and drinking places with recent reviews run two or more of the five systems we detect.
- Toast runs at 40% of New York City places with a POS seen, Square at 27%.
- Resy is on 55% of New York City table-booking places; across US restaurants that take online bookings on OpenTable, Resy, SevenRooms, Tock, Toast Tables or Yelp, OpenTable is on 52%.
- 53% of Toast POS places also use Toast Online Ordering.
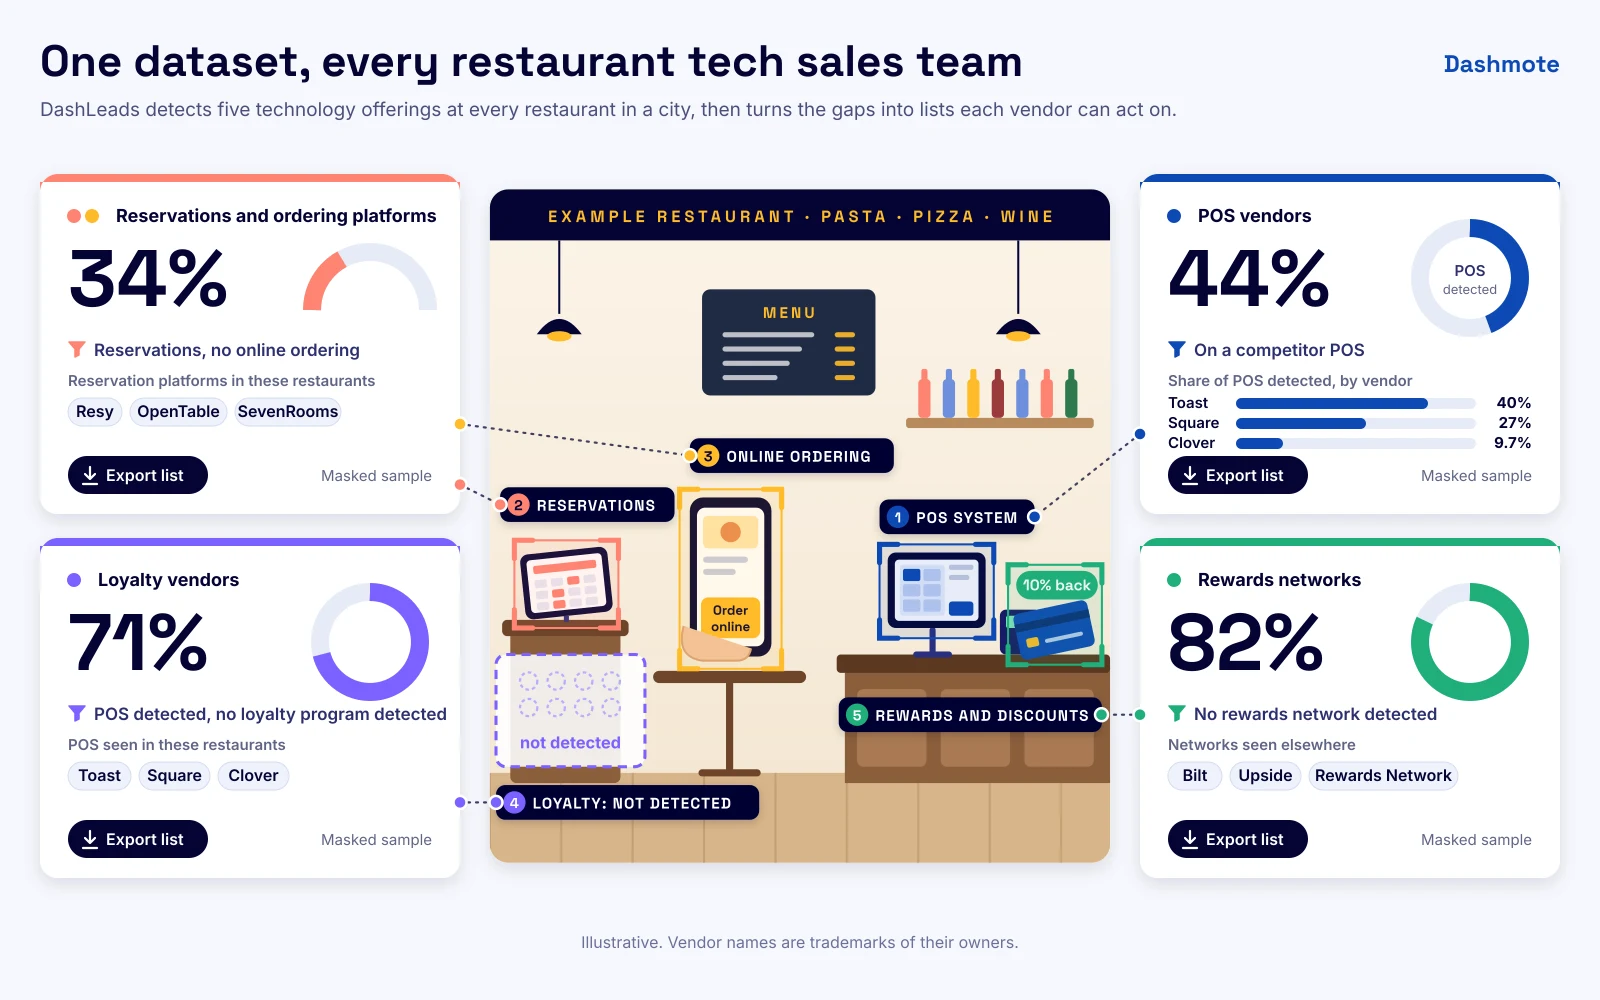
- 71% of New York City places with a POS seen show no loyalty programme in public data.
Every restaurant runs on a stack of software, and every vendor selling into restaurants wants to know whose stack it is. We now detect five systems at every eating and drinking place in a city: the POS, the reservation platform, online ordering, loyalty, and card and dining rewards. New York City is the first city with all five measured place by place.
Five systems, one restaurant
70% of open New York City eating and drinking places with recent reviews show at least one of the five systems, and 43% show two or more. Each system sits on its own base: online ordering shows at 56% of food-serving places (that includes ordering links on Google listings; 37% have ordering confirmed in use), POS at 44% of eating and drinking places and reservations at 27% of table-service restaurants. Loyalty (16%) and card rewards (11%) are the open ground.


Of the places that show at least one system, 39% show exactly one and 61% show two or more.
POS: Toast leads New York City
Of places with a POS seen, 40% run Toast, 27% Square and 9.7% Clover. Toast leads in Manhattan, Brooklyn, Queens, Bronx and Staten Island. Manhattan shows the most POS evidence, at 53% of its open eating and drinking places with recent reviews.

Across the United States the picture is closer. Among the venues we detect on the Toast, Square and Clover directories, the leader changes from state to state, and many states are a close race.

Reservations: Resy in New York City, OpenTable across the US
Of New York City places that take table bookings, 55% use Resy and 46% OpenTable. Across US restaurants that take online bookings on OpenTable, Resy, SevenRooms, Tock, Toast Tables or Yelp, OpenTable is on 52% and Resy on 20%. New York City (places that take table bookings) and the wider New York metro area (restaurants that take online bookings) are different counts. How we count bookable restaurants.

Overlap and cross-selling
The stack is mostly mixed. 53% of Toast POS places also use Toast's own online ordering, and many more pair their POS with a marketplace storefront.


The gap a vendor can sell into
71% of New York City places with a POS seen show no loyalty programme in public data. Each gap is a list a vendor can work.

How we measure
We read each place's website, listings, ordering and booking pages and record the vendors we can see. Every share counts open places with five or more reviews and a review in the last 12 months, and only the places that could use the system: table-service restaurants for reservations, food-serving places (no bars) for online ordering and delivery, every eating and drinking place for POS, loyalty and rewards. Vendor shares are of places where the system is seen; a place can use several vendors, so vendor shares can add to more than 100%. US state maps compare vendors among the venues we detect on their public directories and catalogues, not all restaurants in a state.
See the full data on restaurant technology, Resy vs OpenTable and cross-selling.