
Which POS system (EPOS) do restaurants use?
Toast leads the POS system (EPOS) market in New York City at 40% of places with a POS seen; 44% of open eating and drinking places with recent reviews show a POS system (EPOS), the checkout software. Below: every vendor's share, where each one leads by borough and state, how the same system looks in other markets, and how sales teams use it.
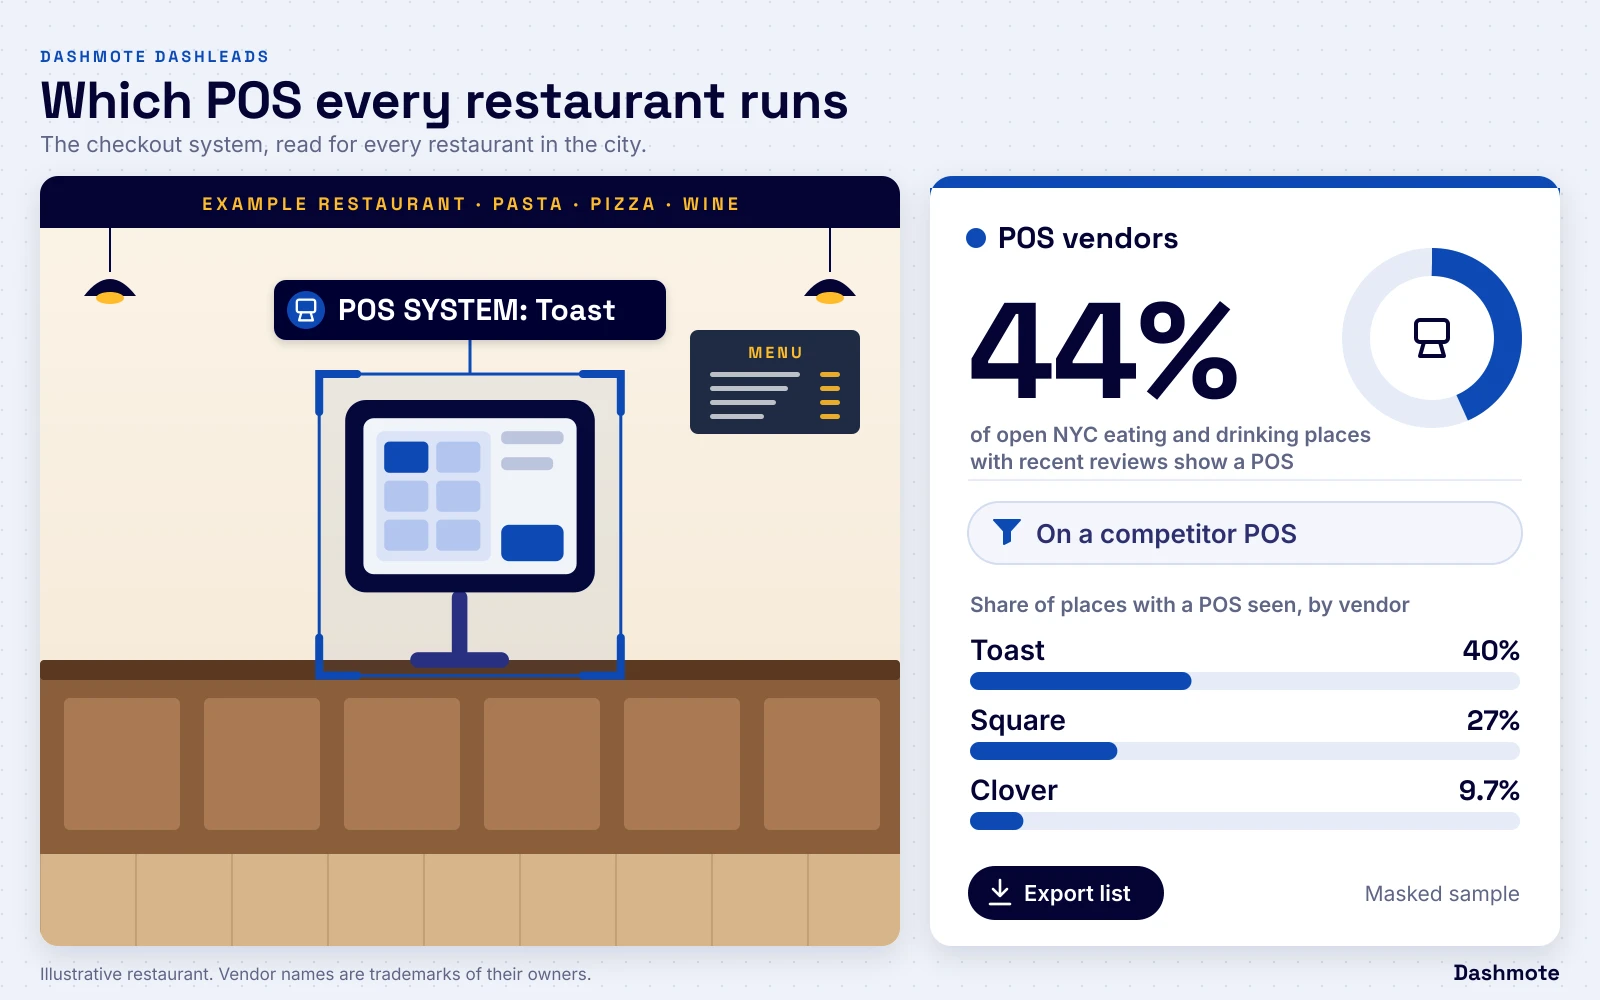
44% of open New York City eating and drinking places with recent reviews show a POS.
Share of open New York City eating and drinking places with recent reviews.
Also in the data
40% of places with a POS seen run Toast, the leading vendor
30% of open New York City eating and drinking places have a POS confirmed in use
4.9% of places with a POS seen use two or more POS vendors
71% of POS places show no loyalty programme
Vendors we track at every restaurant











POS vendors by share
Shares are of places with the system seen; a place can use several vendors, so shares add to more than 100%.
Share of open New York City eating and drinking places with recent reviews and a POS vendor seen.
Show the data as a table
The leading POS vendors in New York City. Share of open New York City eating and drinking places with recent reviews and a POS vendor seen.
| Share | |
|---|---|
| Toast | 40% |
| Square | 27% |
| Clover | 9.7% |
| Oracle Simphony | 7.5% |
| MenuSifu | 5.5% |
| Chowbus POS | 3.4% |
Across the United States
US maps compare vendors among the venues we detect on their public directories and catalogues; they show who leads where, not a share of all restaurants in a state.
Share of venues we detect in the state.Directory listings matched to eating and drinking places in our US base; match coverage differs by vendor (Toast 73% of listings, Square 49%), so Toast is if anything understated. The state view counts listings statewide; New York City figures come from restaurant-level detection, which is why Toast leads the city while Square leads New York State overall.
Show the data as a table
POS across US states. Share of venues we detect in the state.
| State | Leads | Second |
|---|---|---|
| Alabama | Square 51% | Toast 40% |
| Alaska | Square 65% | Toast 20% |
| Arizona | Square 46% (narrow lead) | Toast 42% |
| Arkansas | Square 59% | Toast 32% |
| California | Square 45% (narrow lead) | Toast 40% |
| Colorado | Toast 45% (narrow lead) | Square 42% |
| Connecticut | Toast 44% (narrow lead) | Square 35% |
| Delaware | Toast 56% | Square 32% |
| District of Columbia | Toast 55% | Square 37% |
| Florida | Toast 45% (narrow lead) | Square 41% |
| Georgia | Square 44% (narrow lead) | Toast 42% |
| Hawaii | Square 47% | Toast 30% |
| Idaho | Square 59% | Toast 34% |
| Illinois | Toast 49% (narrow lead) | Square 40% |
| Indiana | Square 50% | Toast 39% |
| Iowa | Square 55% | Toast 37% |
| Kansas | Square 53% | Toast 38% |
| Kentucky | Square 48% (narrow lead) | Toast 43% |
| Louisiana | Square 44% (narrow lead) | Toast 41% |
| Maine | Square 46% (narrow lead) | Toast 45% |
| Maryland | Toast 51% | Square 36% |
| Massachusetts | Toast 56% | Square 36% |
| Michigan | Toast 46% (narrow lead) | Square 42% |
| Minnesota | Toast 49% (narrow lead) | Square 41% |
| Mississippi | Square 52% | Toast 39% |
| Missouri | Square 55% | Toast 35% |
| Montana | Square 56% | Toast 38% |
| Nebraska | Toast 44% (level) | Square 44% |
| Nevada | Toast 45% (narrow lead) | Square 40% |
| New Hampshire | Toast 54% | Square 39% |
| New Jersey | Square 40% (narrow lead) | Toast 39% |
| New Mexico | Square 61% | Toast 29% |
| New York | Square 45% (narrow lead) | Toast 43% |
| North Carolina | Square 49% (narrow lead) | Toast 40% |
| North Dakota | Square 47% (narrow lead) | Toast 43% |
| Ohio | Toast 47% (narrow lead) | Square 41% |
| Oklahoma | Square 57% | Toast 35% |
| Oregon | Square 63% | Toast 27% |
| Pennsylvania | Square 47% (narrow lead) | Toast 42% |
| Rhode Island | Toast 52% | Square 41% |
| South Carolina | Toast 43% (level) | Square 43% |
| South Dakota | Square 55% | Toast 37% |
| Tennessee | Square 51% | Toast 38% |
| Texas | Square 48% (narrow lead) | Toast 40% |
| Utah | Square 51% | Toast 41% |
| Vermont | Square 61% | Toast 34% |
| Virginia | Toast 44% (level) | Square 44% |
| Washington | Square 51% | Toast 34% |
| West Virginia | Square 59% | Toast 31% |
| Wisconsin | Toast 45% (narrow lead) | Square 44% |
| Wyoming | Square 54% | Toast 39% |
DashLeads
The shares are public. The restaurant lists are the product.
- Every restaurant in the city with its detected POS, reservations, online ordering, loyalty and rewards vendors
- Filter by gap: restaurants on a rival's system, or with no system in your slot
- Views by borough, city and state
- Export the list to your CRM
We walk you through your city and your slot.
The POS decides what you can sell
POS here means the point-of-sale system, the checkout software. For posters, menus and fridges in the venue, see POS material detection.
The POS holds a venue's menu, its prices and often its loyalty programme. Ordering, promotions and payments increasingly run through it, so a brand that wants a product listed or priced in a promotion often needs the venue's system, or a partner of it.
Each venue record carries its POS system next to the outlet profile:
| Field | What it tells you | Example values |
|---|---|---|
| POS system | Every checkout system seen at the venue | Toast; Square |
| Systems seen | One, several or none visible | One, several, none found |
| Kind of place | The venue type and cuisine, from the outlet profile | Cafe; pizza restaurant; pub |
| Independent or chain | Whether the venue belongs to a multi-site brand | Independent; chain |
POS by borough
Manhattan shows the most POS; the Bronx the least.
Share of open eating and drinking places with recent reviews in the borough.
Show the data as a table
Where POS is most visible in New York City. Share of open eating and drinking places with recent reviews in the borough.
| Borough | Share |
|---|---|
| Bronx | 30% |
| Brooklyn | 43% |
| Manhattan | 53% |
| Queens | 36% |
| Staten Island | 37% |
London, Amsterdam, Sydney, Melbourne
The POS shows in public less often outside New York City, so these shares rest on a smaller set of places, and local systems lead:
- London: Toast first, then the pub groups' system. Toast is seen at 20% of the places where a POS shows, mostly independent restaurants, cafes and pubs. Then Zonal, at pubs and pizza restaurants of pub and restaurant groups, and Square at coffee shops and brunch places. London.
- Amsterdam: the POS stays behind the counter. Most venues do not show their POS in public. Lightspeed, MplusKASSA and Tebi come up at similar rates, so there is no leader: Lightspeed at independent sit-down restaurants, MplusKASSA at multi-site fast food and Tebi, founded in Amsterdam, at independent restaurants, cafes and wine bars. Amsterdam.
- Sydney and Melbourne: the format decides. Square leads at cafes and then restaurants of every kind, at 44% of Sydney places with a POS seen; Redcat is the chains' system (bubble tea, juice, burgers, chicken) and Abacus leans to Asian restaurants. Sydney, Melbourne.
Share of open eating and drinking places with recent reviews and a POS vendor seen in each city.
Show the data as a table
POS vendors seen outside New York City. Share of open eating and drinking places with recent reviews and a POS vendor seen in each city.
| Share | |
|---|---|
| London: Toast | 20% |
| London: Zonal | 17% |
| London: Oracle Simphony | 11% |
| London: Square | 11% |
| Amsterdam: Lightspeed | 23% |
| Amsterdam: MplusKASSA | 22% |
| Amsterdam: Tebi | 20% |
| Sydney: Square | 44% |
| Sydney: Redcat | 16% |
| Sydney: Abacus | 6.7% |
| Sydney: Lightspeed | 5.8% |
| Melbourne: Square | 48% |
| Melbourne: Redcat | 12% |
| Melbourne: Abacus | 9.0% |
| Melbourne: Deliverit | 4.7% |
How teams use POS system data
- POS and payments companies. List the venues on a rival system, by kind of place, and see where each system is strong before you plan a territory.
- Ordering and loyalty apps. Pick the venues on systems you integrate with, so the first conversation is about value, not about integration work.
- Food and drinks brands. Segment accounts by system: a cafe on Square and a Chinese restaurant on MenuSifu need different partners and a different pitch.
- Everyone. Treat a visible system as a signal: a venue whose POS shows in public usually also runs online ordering, gift cards or loyalty.
More vendors we track
Vendors with too few public figures for a page of their own, with what we can show. Each one is in the restaurant lists, next to the vendors above.
- SpotOn. A POS for full-service restaurants, bars and counter service, sold as a suite. SpotOn POS places in New York City use its loyalty at 30%.
- Oracle Simphony. An enterprise POS for hotels, venues and restaurant groups. 7.5% of New York City places with a POS seen.
Every vendor we detect
Vendor names and logos are trademarks of their owners. Dashmote is not affiliated with any vendor shown.



POS vendors we detect
- Toast
- Square
- Clover
- SpotOn
- SkyTab
- Lightspeed
- Revel Systems
- TouchBistro
- Aloha
- Heartland
- Oracle Simphony
- PAR Brink
- MenuSifu
- HungerRush
- CAKE
- Dripos
- GoTab
- Chowbus
- Slice
- Owner.com
- Otter
- Tebi
- unTill
- Zonal
- Vita Mojo
- Flipdish
- Redcat
- Oolio
Frequently asked questions
What are the top 5 POS systems for restaurants?
In New York City: Toast (40% of places with a POS seen), Square (27%), Clover (9.7%), Oracle Simphony and MenuSifu.
Is Square or Toast more popular?
In New York City, Toast: 40% against 27% for Square. Across US directory listings the two are close and Square leads in more states.
Is a POS system the same as POS material?
No. A POS system (EPOS) is the checkout software a restaurant takes orders and payments on; POS material (POSM) is the branded posters, menus and fridges placed in the venue, which we read in POSM detection.
What is a restaurant POS system?
The point-of-sale system is the checkout software a restaurant, cafe or bar uses to take orders and payments. It often also holds the menu, the prices, online ordering and the loyalty programme.
Is this a market share?
In New York City it is the share of the places where the POS can be seen, which is 44% of open New York City eating and drinking places with recent reviews. A venue that shows no system may still run one.
Does POS here mean POS materials?
No. This page is about the point-of-sale system. For posters, menus and fridges in the venue, see POS material detection.
How do I get the data?
As a list of venues with their POS system, next to the outlet profile, for the city or territory you sell into. Ask for a sample on the demo page.
What is the most used POS system for restaurants?
Toast, in New York City: 40% of places with a POS seen run it.
Who is Toast's biggest competitor?
Square: 27% of New York City places with a POS seen run Square, against 40% for Toast.
What is the market share of POS systems?
In New York City: Toast 40%, Square 27%, Clover 9.7% of places with a POS seen.
Related reading
For sales leaders: the business case
Knowing the POS by venue turns "can we run this here?" into a list.
- Integrations planned city by city. Two systems cover most of New York City's visible market; London, Amsterdam and Sydney each need a different set.
- The right partner per account. Reps bring the partner the venue's system already works with.
- Digital operators first. Venues that show their system tend to run more online tools, so they are quicker to say yes.