The trusted intelligence layer for teams selling to Hospitality & Retail







Data doesn't have to be a pain
The issue
- 1.Brand performance and market trends shift every month, across regions and apps
- 2.No view of execution gaps such as missing products, images or combos
- 3.Trade audits are slow and irregular, so you do not know where competitors win today
The solution
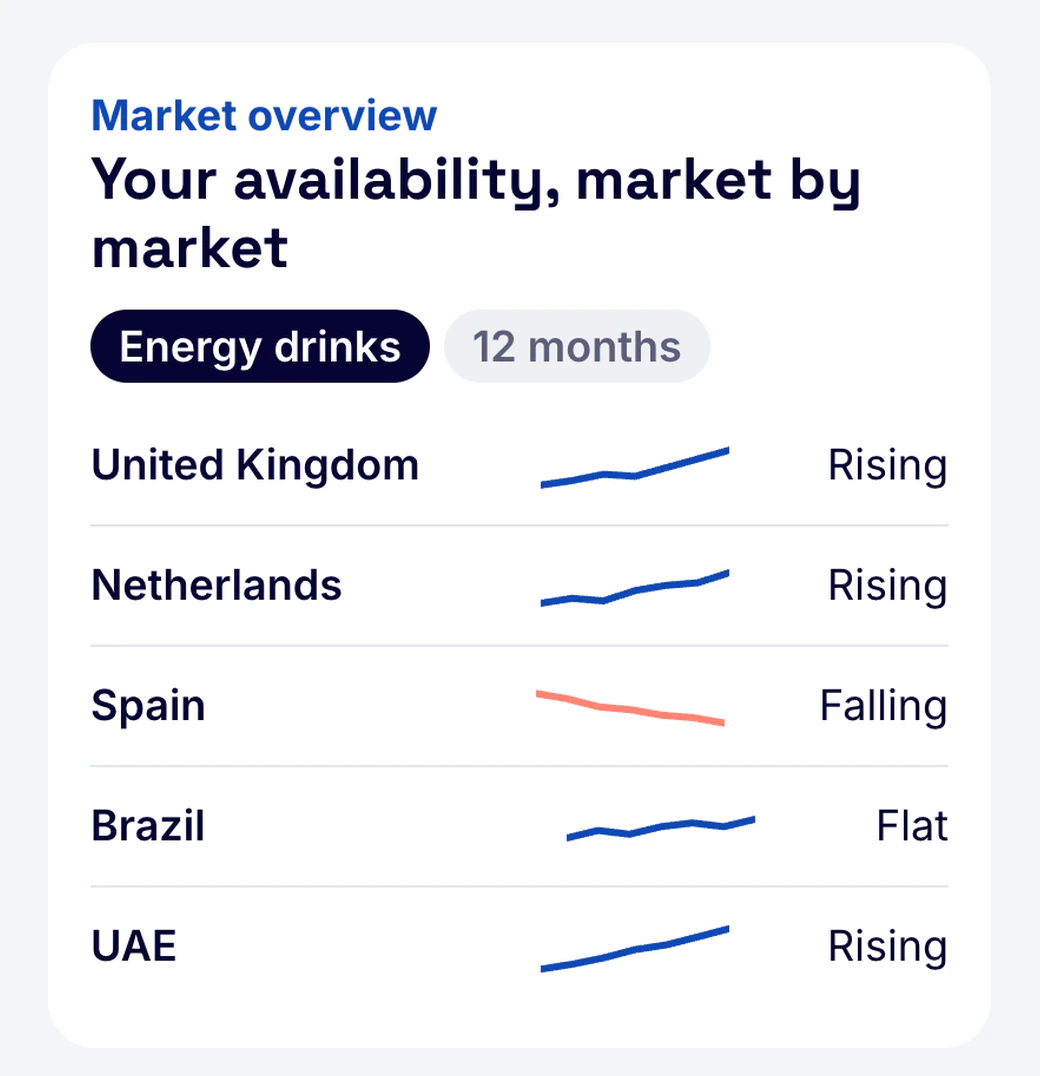
- 1.Track brand performance and market shifts in 60+ countries, refreshed monthly
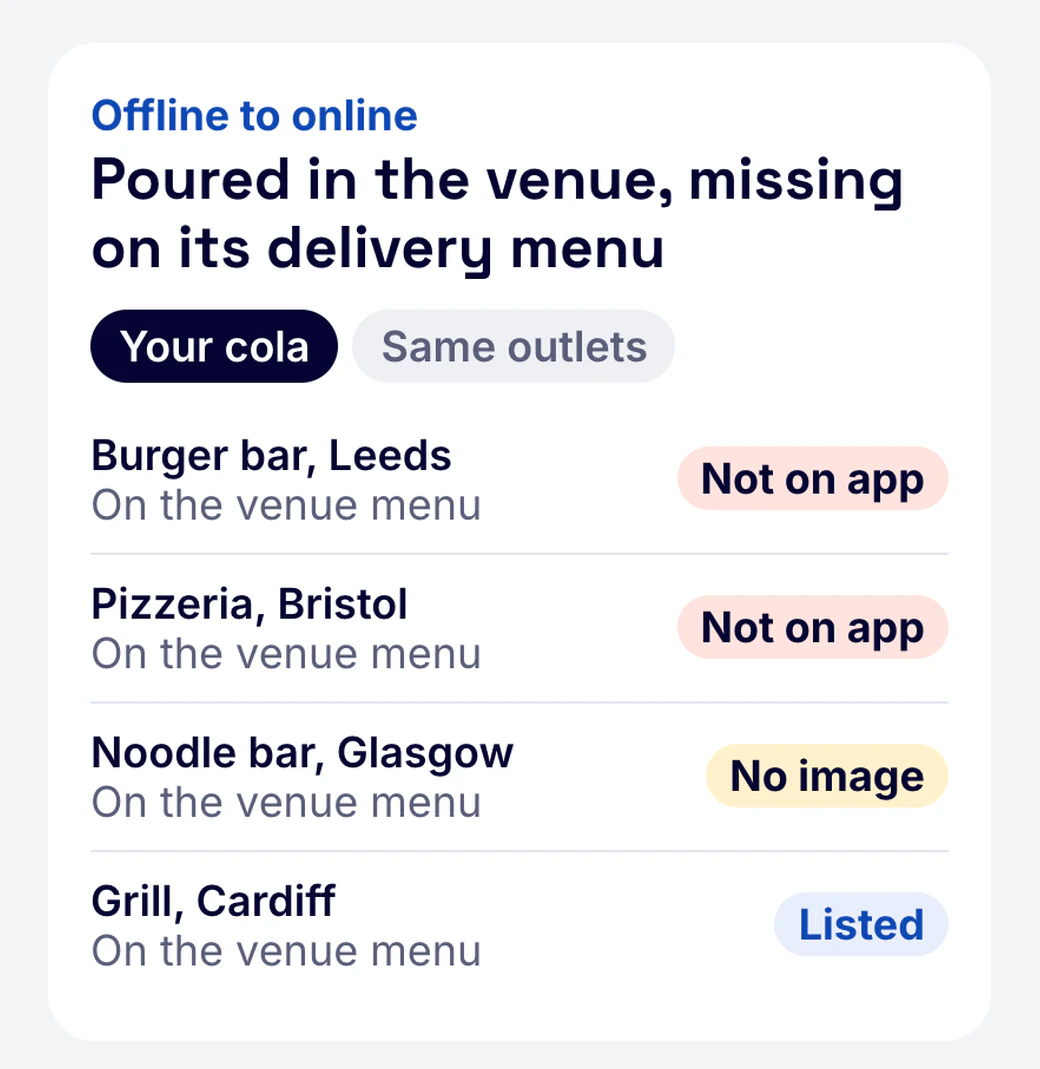
- 2.Detect every execution gap, outlet by outlet, so you fix what matters most
- 3.See where competitors are winning, and where you can win the outlet back
The result
- 1.Teams work from current data and act before a gap costs sales
- 2.Your products are listed, pictured and priced right on every app
- 3.Competitors lose ground in your key accounts

Combos and meal deals
On a delivery menu, a drink or a side is often chosen inside a combo or meal deal. If your product is not in the bundle, the shopper takes what is.
- Find outlets where your product is missing from the combo
- Compare combo inclusion with competitors, outlet by outlet
- Check key accounts against the combos head office agreed
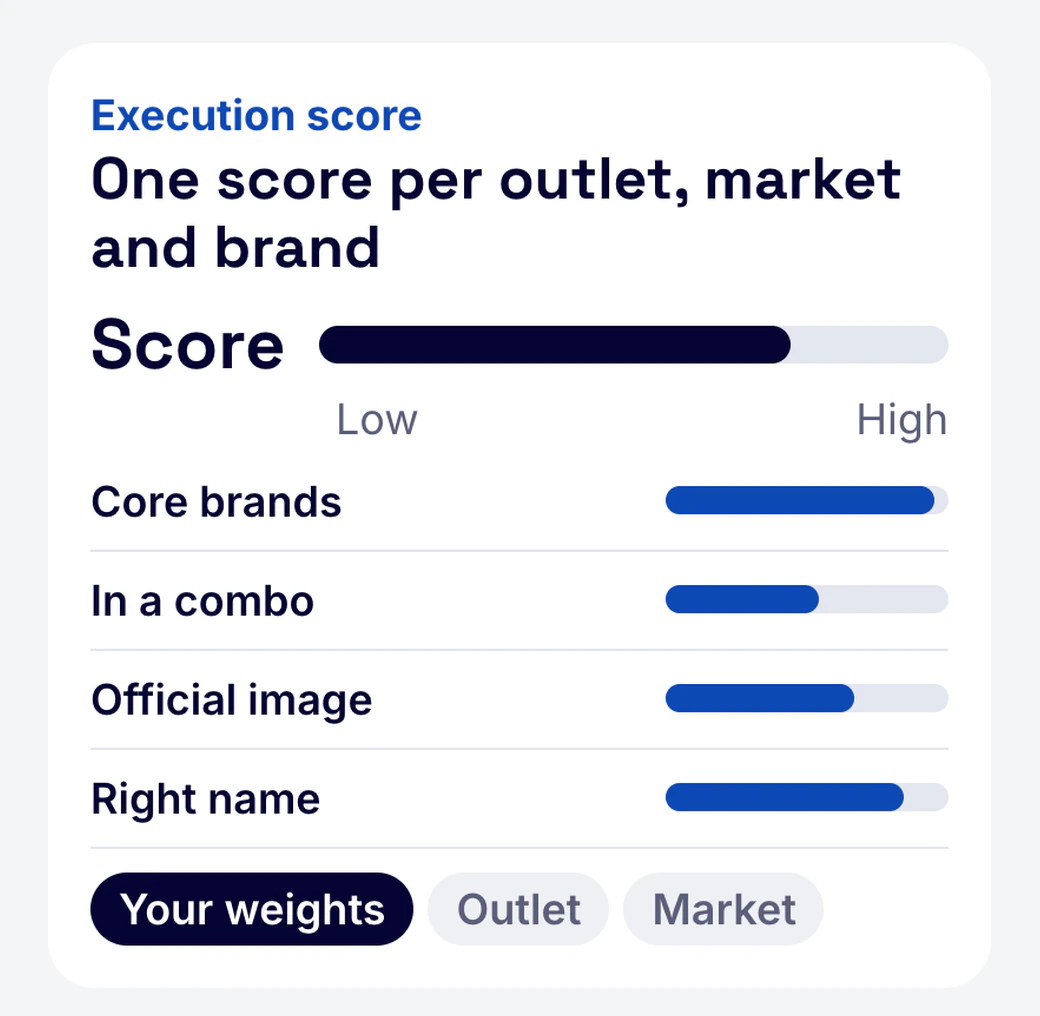
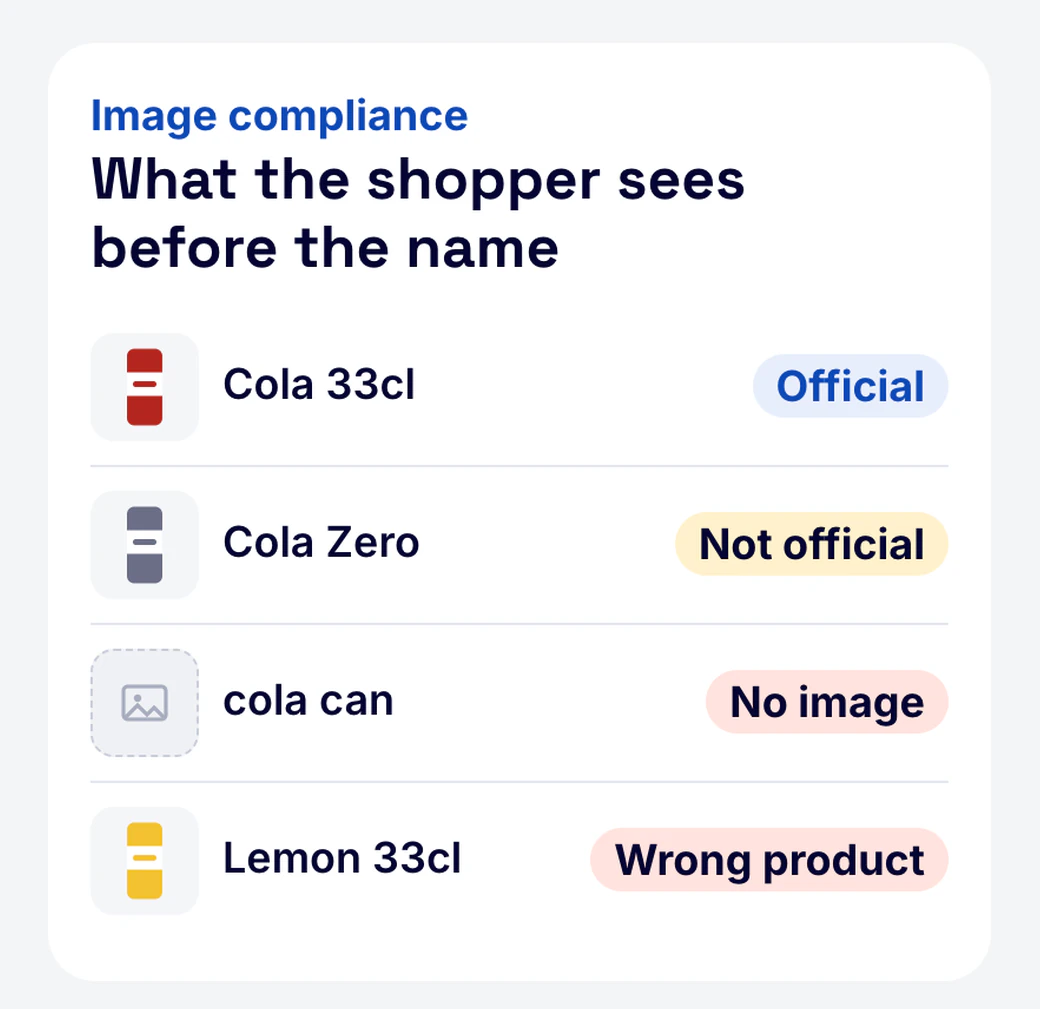
Official images, outlet by outlet
On a delivery app the shopper sees the image before the name. See which outlets show no image, a non-official image or the wrong product, per app and per market.
- Detect image presence, absence or mismatch
- Compare image rates by brand and market
- Export the outlet list for your account team
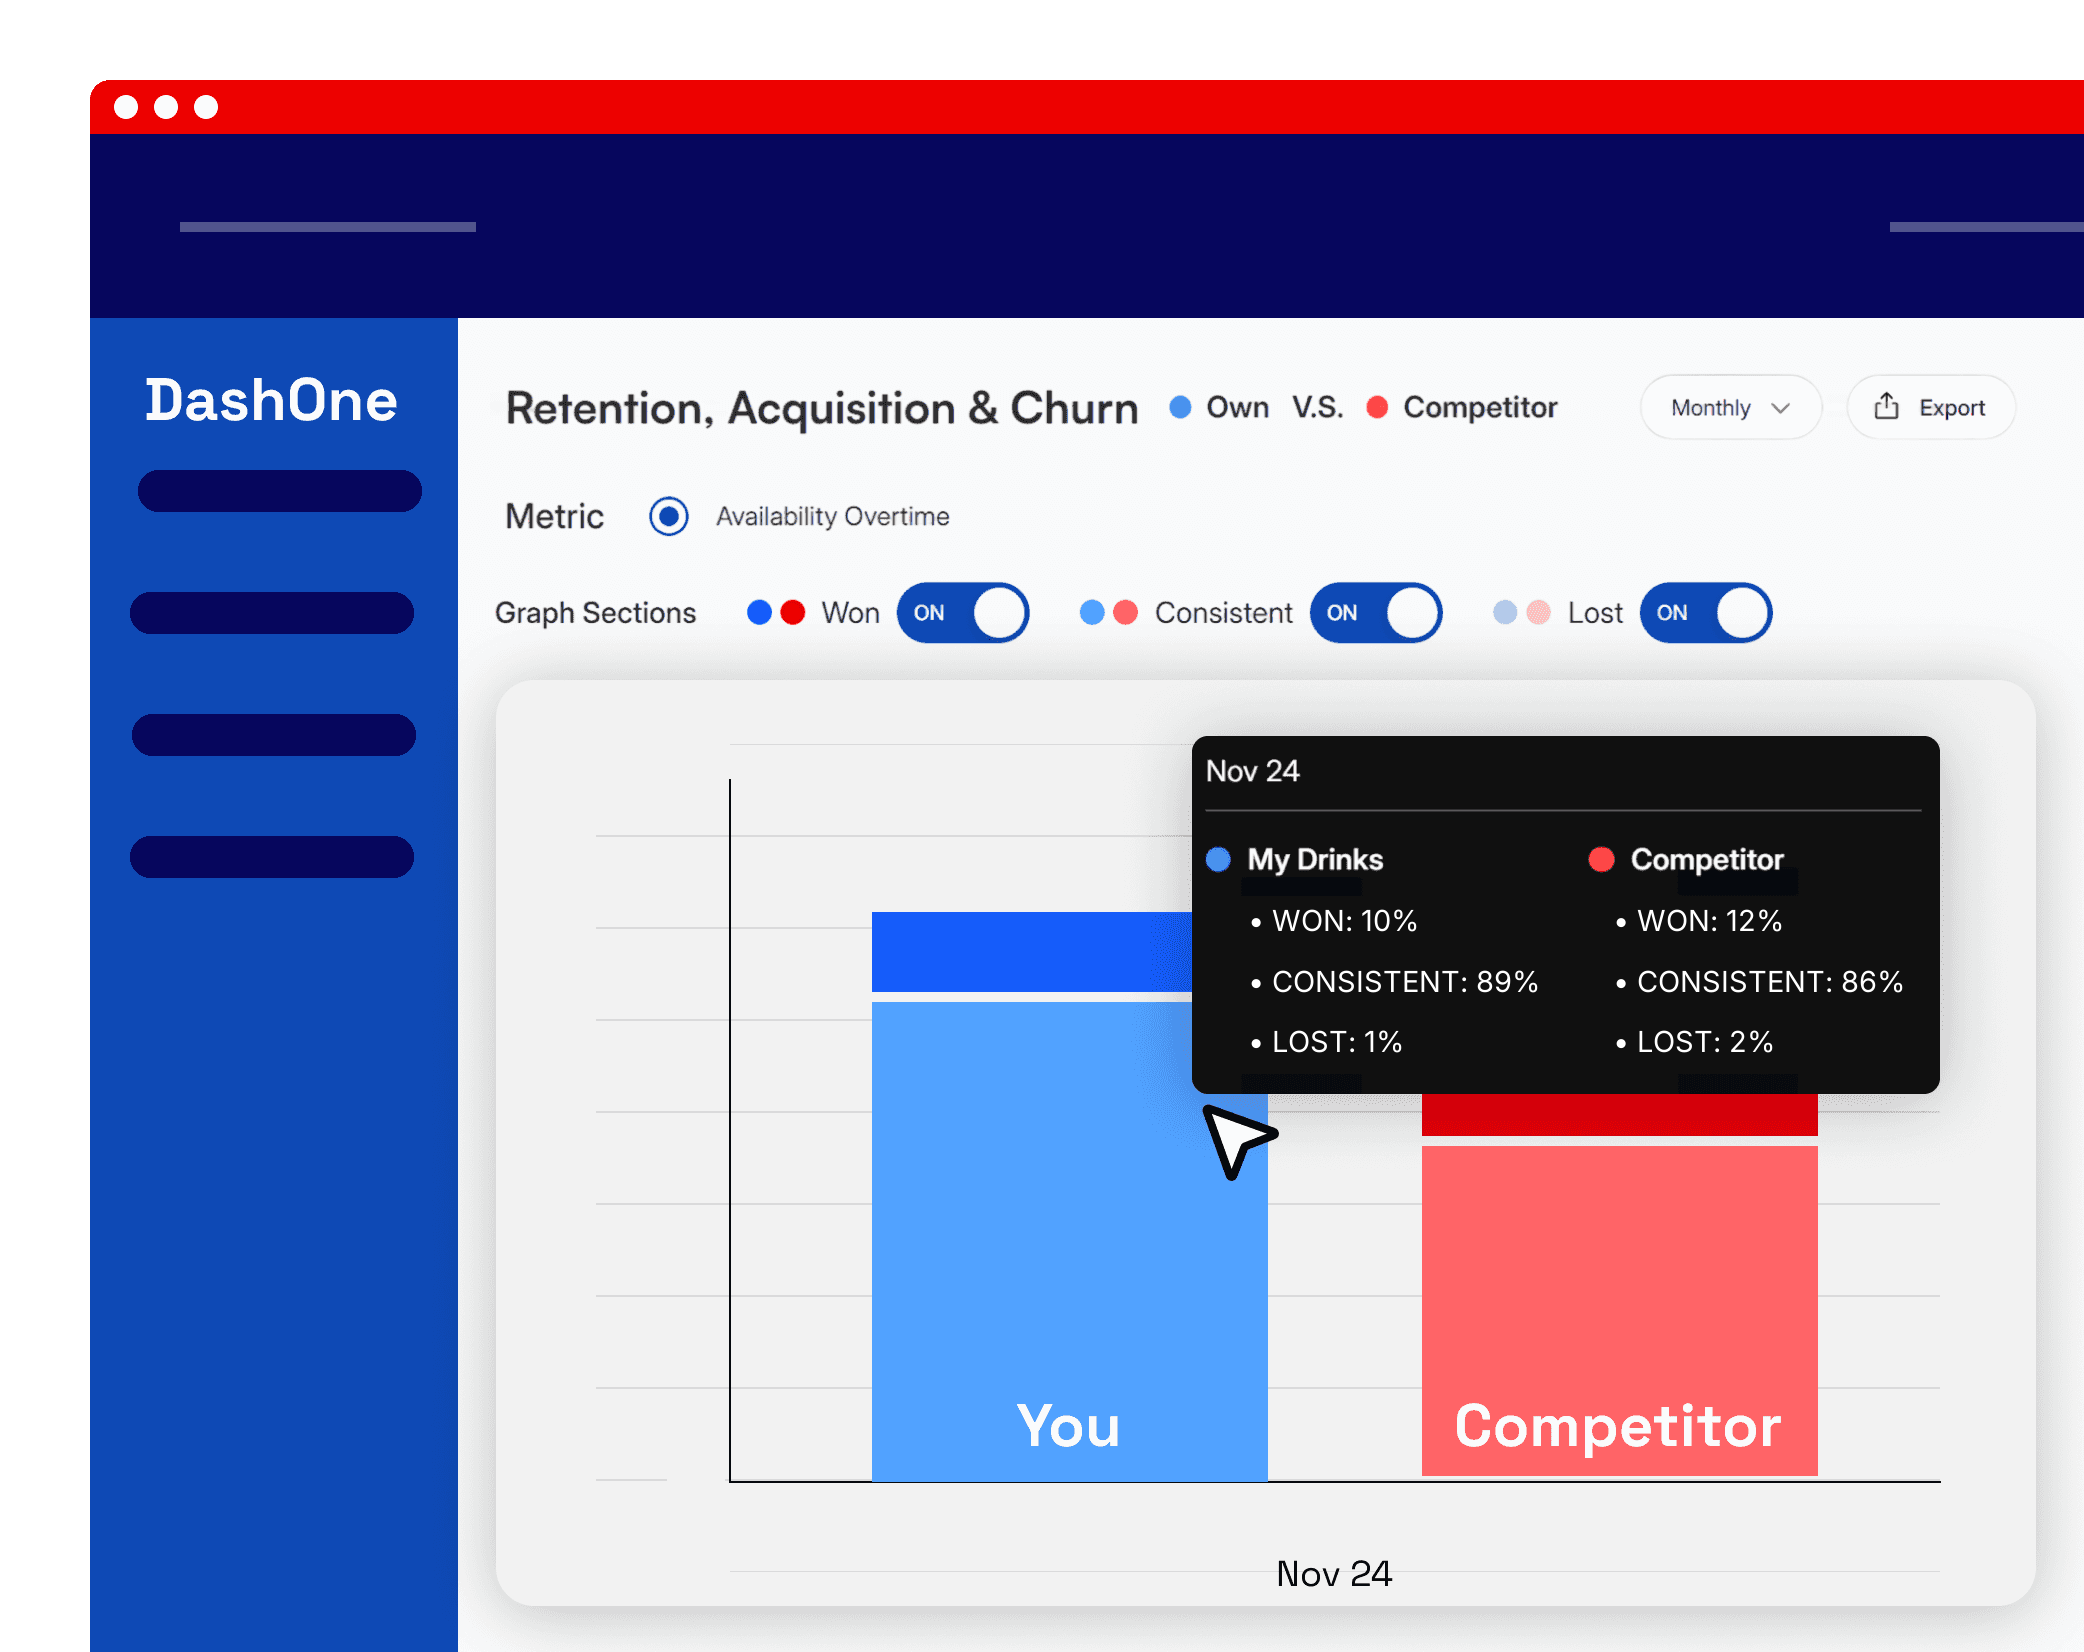
Where competitors hold the spot
See where competitor brands are listed, where they are the only option and where they share the menu with you. The outlets where they stand alone are where you can win.
- Map competitor listings by brand, region or chain
- Separate shared outlets from competitor-only outlets
- Track your digital shelf share refresh by refresh

What we track: the KPIs on delivery apps
On a delivery app your shelf is a menu. Six KPIs describe it, and each has a simple formula so every market reports the same way.
| KPI | Formula | Question it answers |
|---|---|---|
| Availability (numeric distribution) | outlets listing your brand divided by outlets listing the category | Is my product listed in every outlet that should have it? |
| Weighted distribution | weight of outlets listing your brand divided by weight of all category outlets | Am I in the outlets that matter most? |
| In-stock rate | listings shown as orderable divided by all listings observed | When I am listed, can shoppers actually buy it? |
| Price index | your median delivery price divided by competitor median price, times 100 | Why does my price differ by platform, and against whom? |
| Digital shelf share | your category listings divided by all brand listings in the category, times 100 | Of everything on offer in my category, how much is mine? |
| Menu presence quality | listings with correct name, image and combo inclusion divided by all your listings | Is my product shown in a way that sells? |
The outlet lists behind each number are on listing and availability tracking.
Go deeper: one job per page
Frequently asked questions
What food delivery data does Dashmote provide for brands?
Dashmote provides outlet-level data from 100+ delivery and quick commerce platforms in 60+ countries: whether each storefront lists your products, what it charges, whether the listing has the right image, name and combo, and which competitors are listed instead.
Which delivery and quick commerce platforms do you cover?
DashONE covers 100+ platforms in 60+ countries, including Uber Eats, DoorDash, Deliveroo, Just Eat, Glovo and Grab. Coverage is city by city, and a sample shows exactly which cities are included for your market.
Which KPIs matter on a delivery app?
The KPIs that matter on a delivery app are availability, in-stock rate, price index, digital shelf share and menu presence quality (name, image and combo inclusion). Together they show whether you are listed, buyable, priced right and shown in a way that sells.
How often is the data refreshed?
The data is refreshed monthly, and every figure carries the date it was observed. Historical observations are kept, so trends, delistings and price changes can be compared period on period.
Can I see the data for one app or one country?
Yes. The major apps have their own pages (Uber Eats, Deliveroo, Just Eat), and food delivery data by country lists storefront counts per country and app. For how to compare providers, see digital shelf analytics for food delivery.
Platforms we track
Dashmote tracks 15M+ delivery storefronts on 100+ platforms in 60+ countries. Each storefront is a restaurant, pub or store menu, read item by item for your brand and your competitors.
- Uber Eats
- DoorDash
- Deliveroo
- Just Eat
- Glovo
- Wolt
- foodpanda
- talabat
- iFood
- Rappi
- PedidosYa
- Grubhub
- SkipTheDishes
- Instacart
- Grab
- ShopeeFood
- LINE MAN
- Be
- Careem
- HungerStation
- Jahez
- noon Food
- Yemeksepeti
- Getir
- efood
- Bolt Food
- Yandex Eats