POS systems in New York, Amsterdam and Sydney: what brands need to know
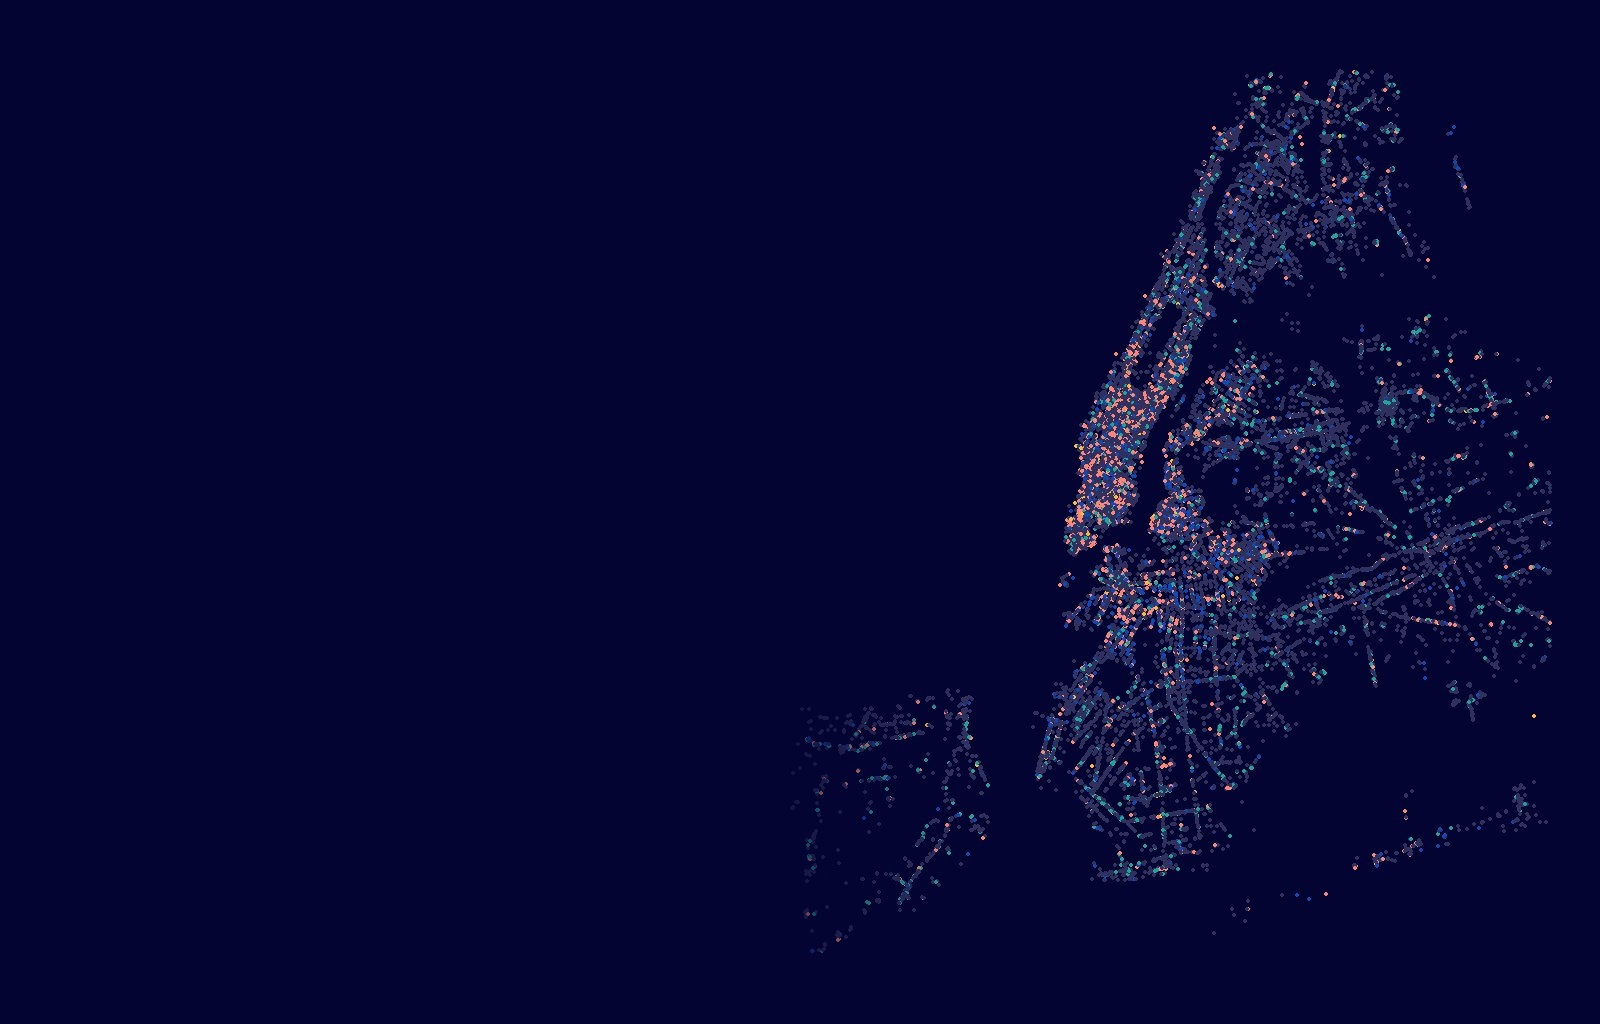
New York has a visible POS signal at 29% of restaurants, cafes and bars, compared with 10% in Sydney and 4% in Amsterdam. Within New York's visible set, Toast or Square appears at 72% of venues.
Key findings
- A POS is visible at 29% of New York venues, 10% of Sydney venues and 4% of Amsterdam venues.
- Toast or Square appears at 72% of New York venues with a visible POS, with both visible at 3%.
- Lightspeed, MplusKASSA or Tebi appears at 61% of Amsterdam venues with a visible POS.
- Square or Redcat appears at 65% of Sydney venues with a visible POS.
- The practical integration shortlist changes by city, even when the same restaurant formats appear in each market.
New York is the easiest of these markets to read: a POS is visible at 29% of restaurants, cafes and bars, compared with 10% in Sydney and 4% in Amsterdam. The difference matters for F&B brands because integrations, digital promotions and loyalty activations often depend on the system running behind the counter.
The visible market also has a different shape in each city. Toast or Square appears at 72% of New York venues with a visible POS. Square or Redcat appears at 65% in Sydney. Amsterdam's leading trio, Lightspeed, MplusKASSA and Tebi, appears at 61%. The result is a different integration shortlist in each city.
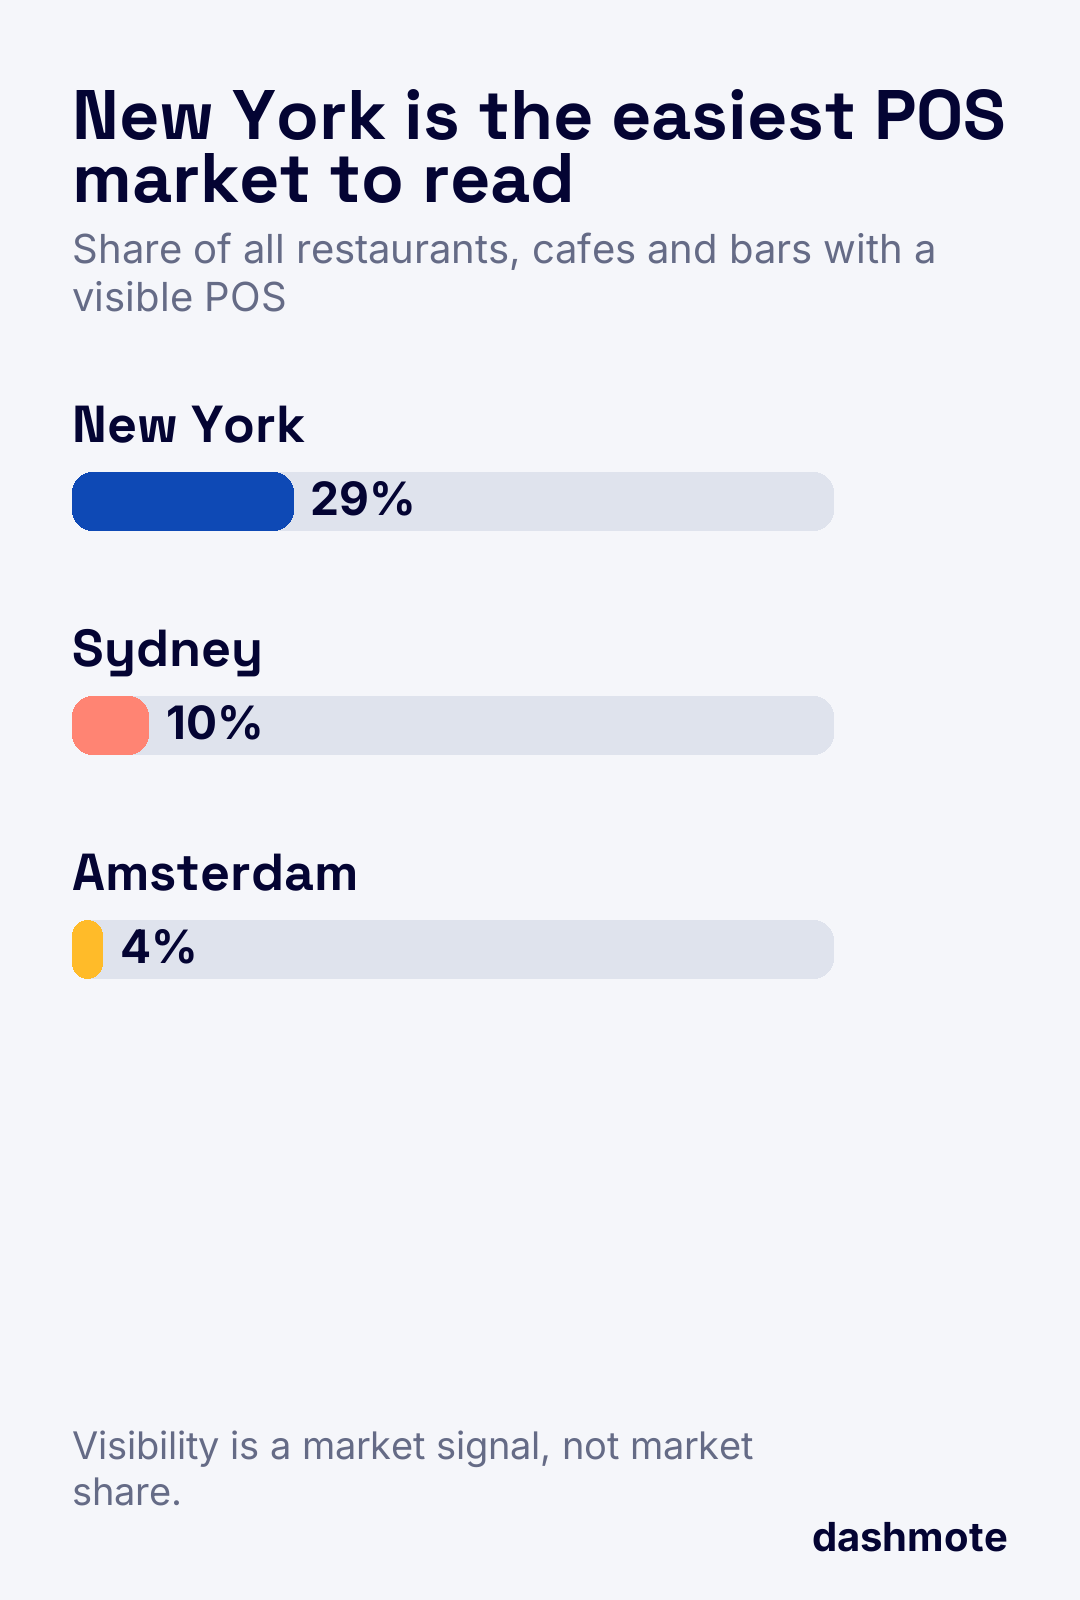
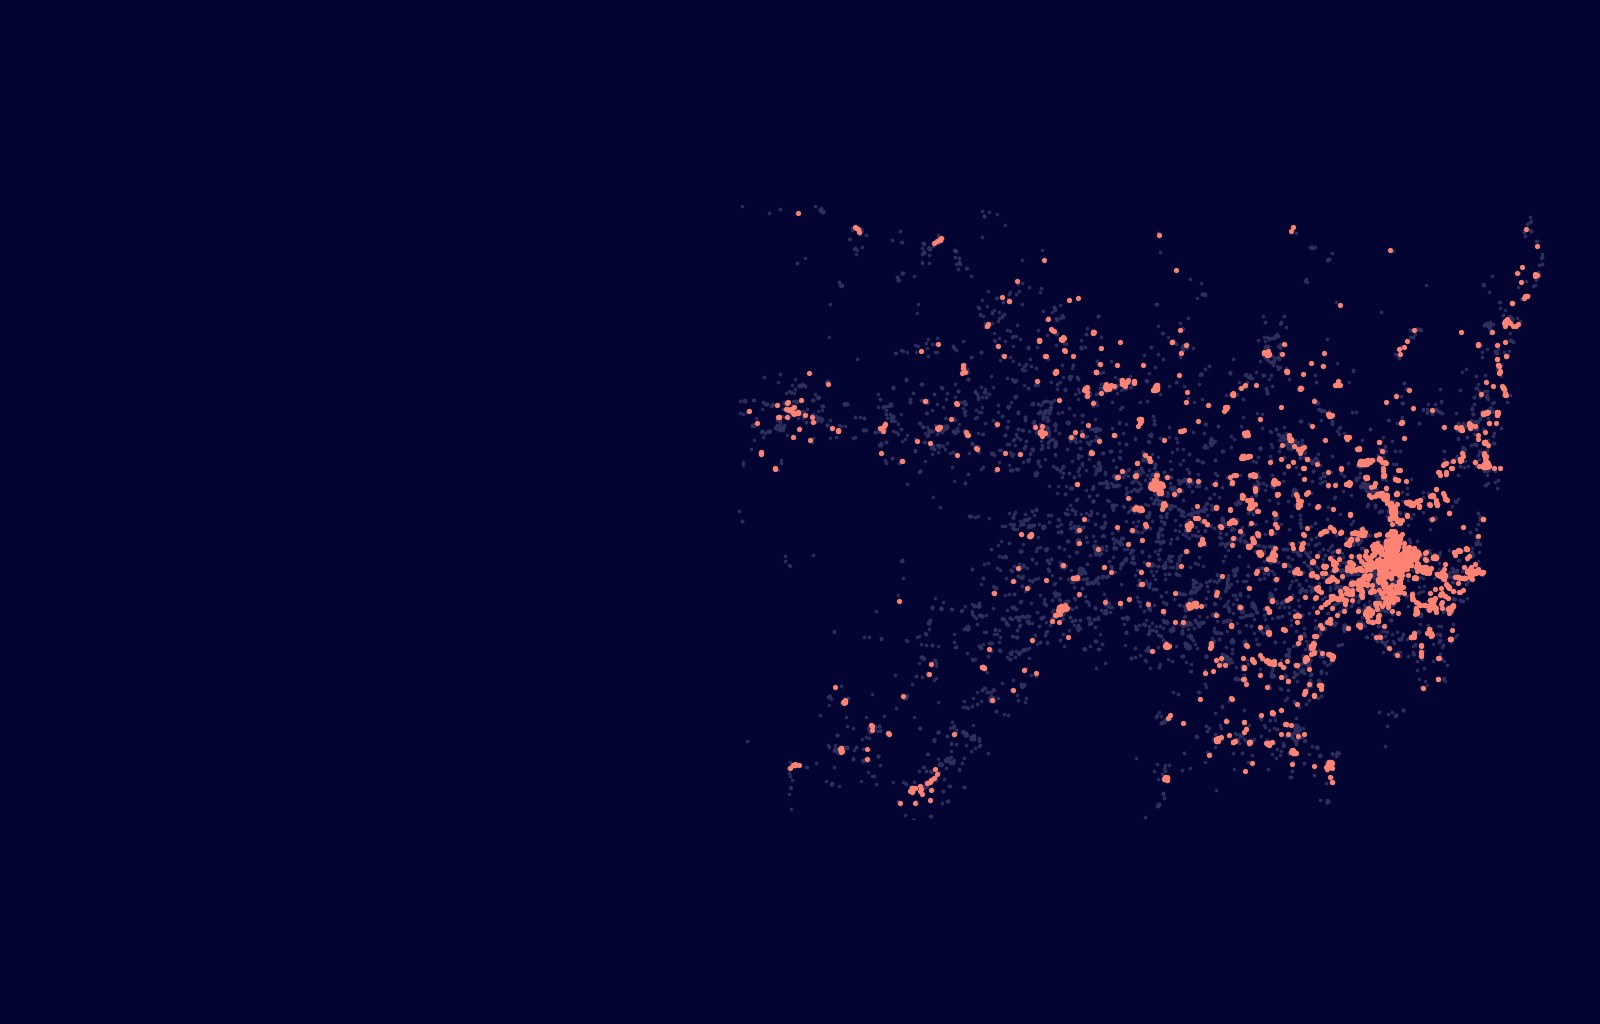
Share of all restaurants, cafes and bars with a visible POS, October 2026. Visibility is a market signal, not market share.
New York concentrates around Toast and Square
Toast appears at 44% of New York venues with a visible POS, Square at 30% and Clover at 7%. Toast or Square appears at 72%, while both systems are visible at 3%.
That concentration gives a brand a practical starting point. A promotion or data connection designed around Toast and Square can address a broad part of the digitally visible restaurant market. Clover adds another distinct segment, while specialist systems still matter in restaurant categories where the national leaders are not dominant.
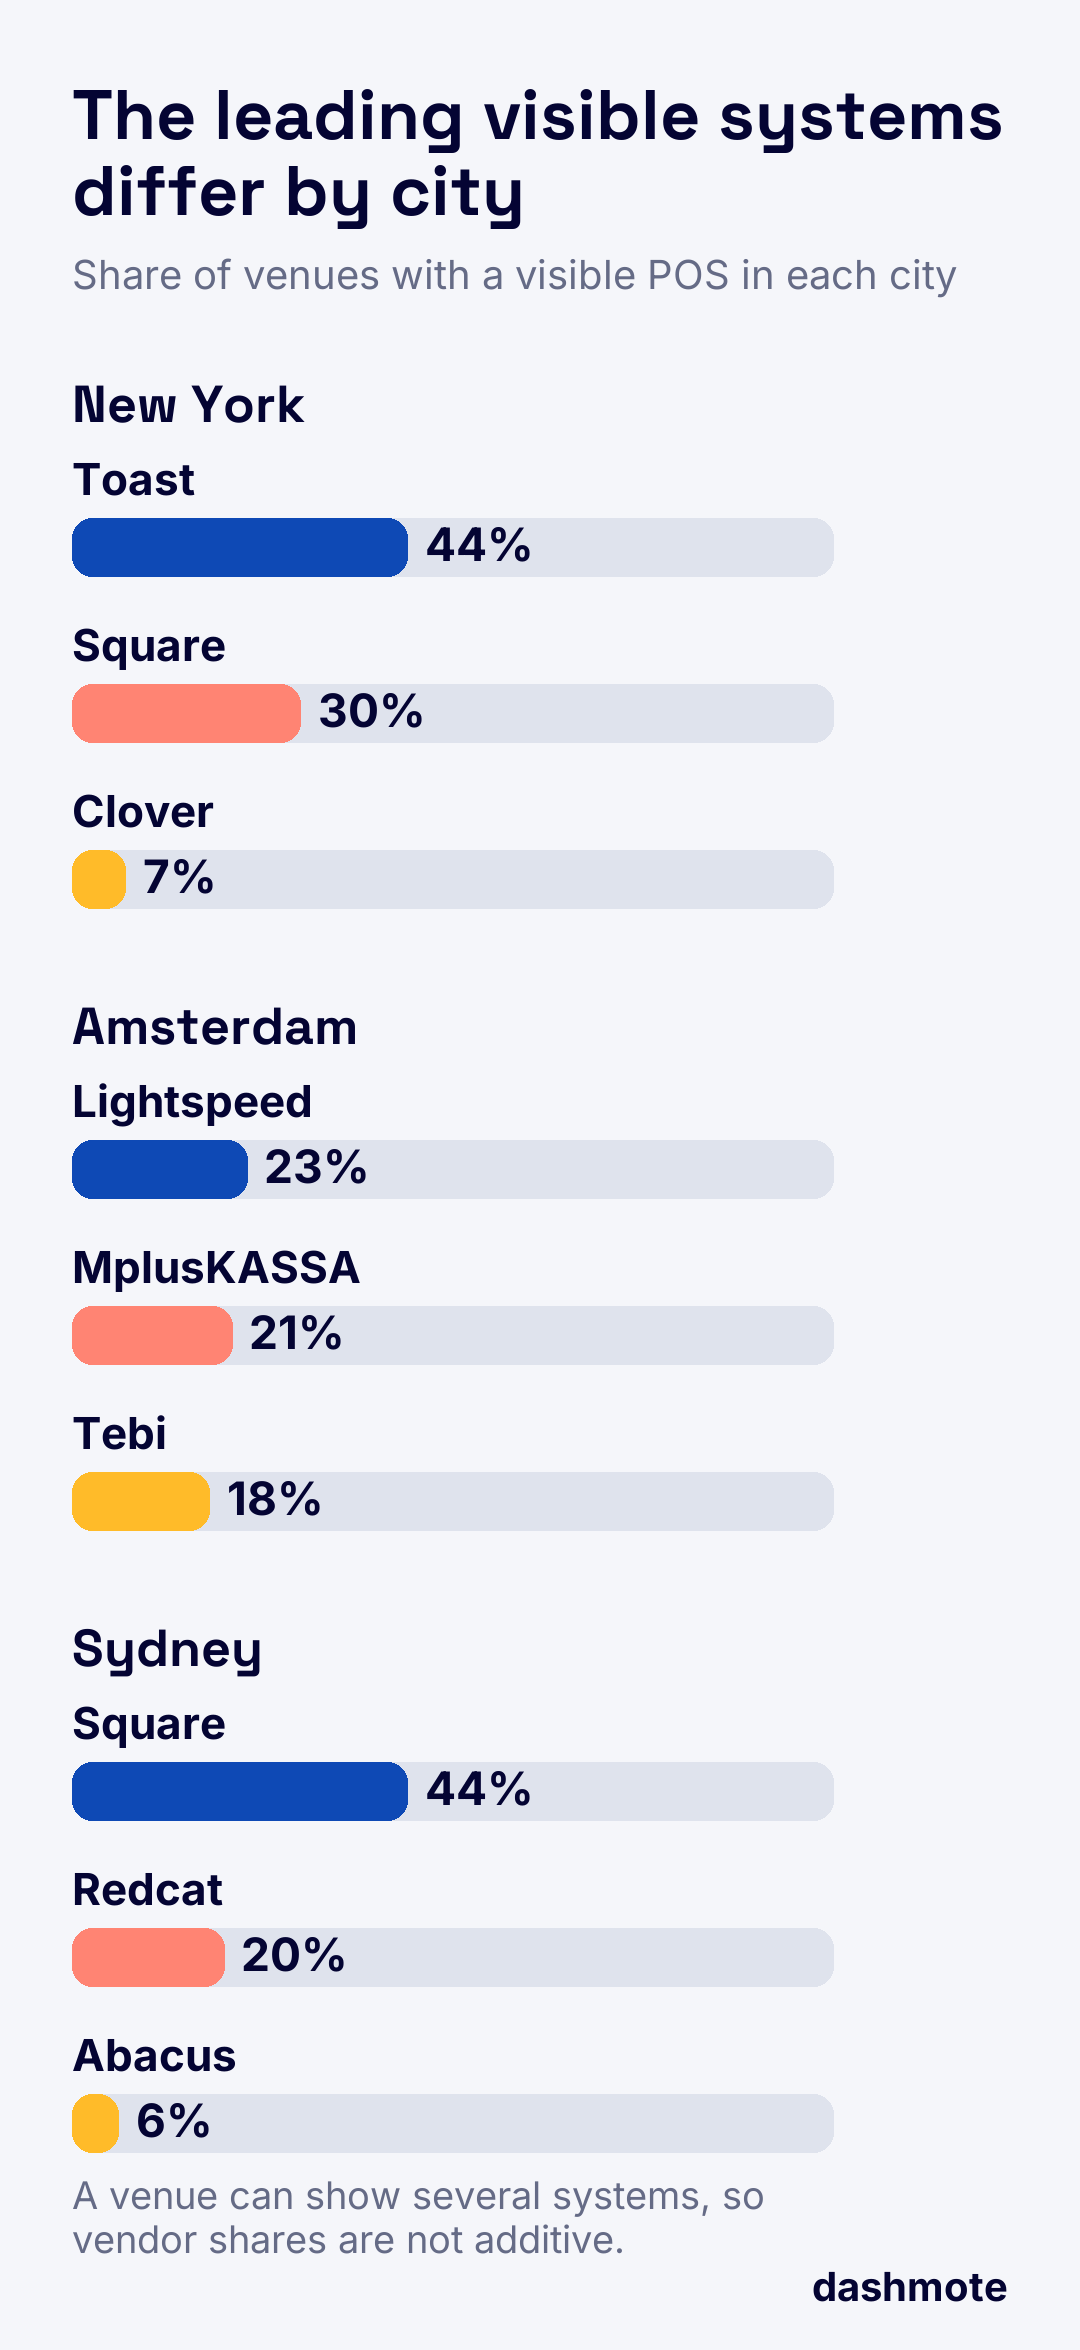
Share of venues with a visible POS in each city. A venue can show several systems, so vendor shares are not additive.
Amsterdam has a close leading group
Lightspeed appears at 23% of Amsterdam venues with a visible POS, MplusKASSA at 21% and Tebi at 18%. Together, the group appears at 61% of the visible set. These shares come from the smaller set of venues whose till is visible. Lightspeed or MplusKASSA together reach 43%.
Amsterdam's narrower visibility changes the commercial task. The leading systems are closely grouped, so a single integration does not define the market. Account selection needs the venue-level system attached to it, especially when a field team is deciding which operators can support a digital offer now and which need a different route.
Sydney combines a broad leader with strong local depth
Square appears at 44% of Sydney venues with a visible POS, Redcat at 20% and Abacus at 6%. Square or Redcat appears at 65% of the visible set.
Sydney therefore has a clear lead system without becoming a single-system market. Redcat and Abacus create meaningful operator groups beside Square. For brands, that supports a city-specific partner plan instead of importing the New York shortlist.
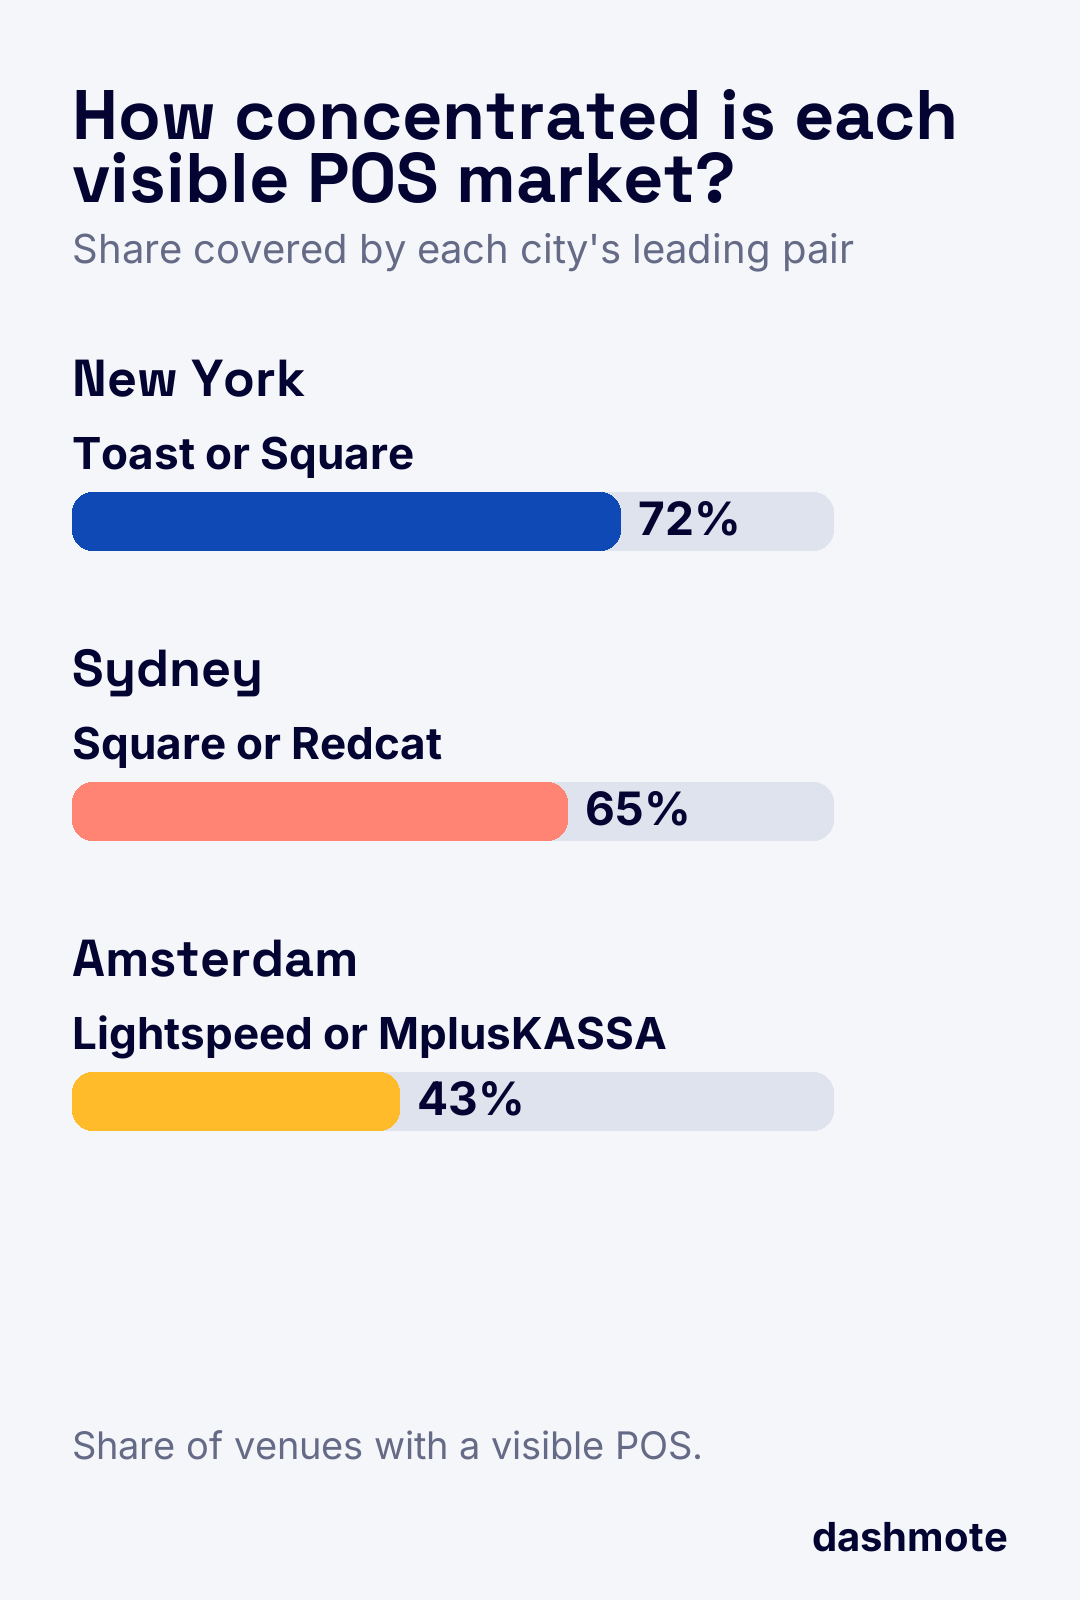
Share of the visible POS set covered by each city's leading pair.
What F&B brands should do
- Prioritise integrations by city. New York rewards depth with Toast and Square. Sydney needs Square plus strong local coverage. Amsterdam needs a balanced portfolio.
- Attach the system to the account. A city ranking helps with strategy, but the venue-level signal tells a rep which activation is realistic at a specific restaurant.
- Connect POS to the rest of the stack. Pair the system with ordering, loyalty and reservation signals to identify digitally active operators and choose the right pitch.
Explore the restaurant technology data hub, the restaurant POS data, restaurant loyalty data and restaurant reservation data pages. Continue with the companion analysis of restaurant loyalty programmes in New York, Amsterdam and Sydney, the city view of Sydney restaurant technology and the booking analysis of Singapore restaurant reservations.
DashLeads shows which venues exist, what they serve and which restaurant technologies are visible at each location. Book a demo to turn those signals into a market and account plan.