Introduced in 1967 by McDonald’s franchise owner Jim Delligati, the Big Mac can be purchased today in over 100 countries. While the ingredients remain the same worldwide, the cost of a burger varies depending on which part of the world you are in, as evidenced by the Big Mac Index. The Big Mac Index [1] not only highlights the economic disparities between nations, but also serves as a tangible measure of purchasing power and cost of living across the globe, making it an essential tool for economic analysis and insight.
In a previous article, we showcased price comparisons of Big Macs in 2022 [link], and now it is time for us to circle back to our annual tradition and bring you the latest insights from the Big Mac Index over the past year.
At Dashmote, we aim to harness technology to bring you a comprehensive view of the food delivery landscape worldwide. This index is about more than comparing prices; it's about uncovering valuable economic insights and inflationary trends.
*prices were normalized to USD for better comparison
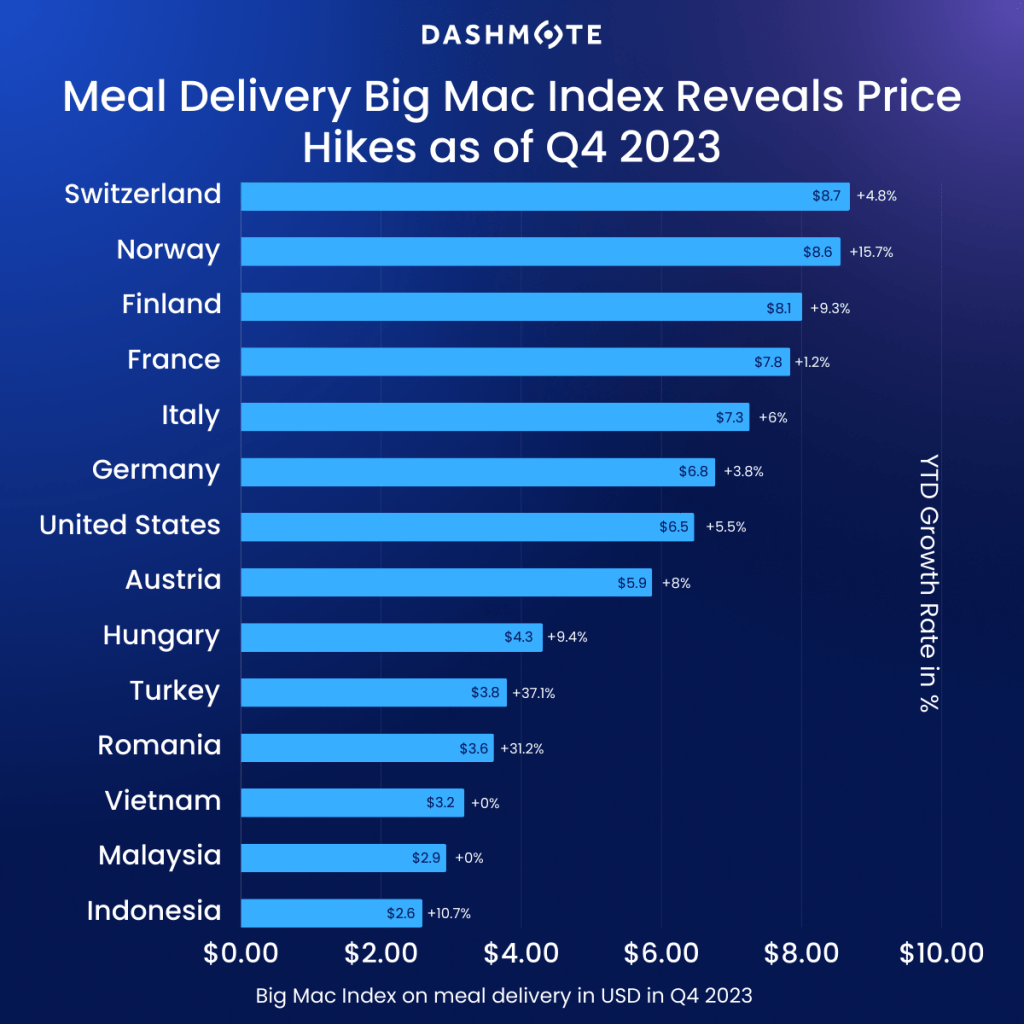
- From the 29 countries we did the analysis on, we note that average Big Mac prices on Food Delivery can vary from $2 up to almost $9.
- Switzerland ($8.7), Norway ($8. 6) and Finland ($8.1) are the countries with the highest Big Mac prices.
- Indonesia ($2.6), Malaysia ($2.9) and Vietnam ($3.2) turned out to be the countries with the lowest prices out of all the ones we analyzed.
- Over the course of 2023, countries with the highest inflation rates are Turkey (+37.1%), Romania (+31.2%) and Norway (+15.7%).
- The lowest inflation rates come from France (+1.2%) and Germany (+3.8%).
- Interestingly, Malaysia and Vietnam Big Mac prices were the same, with 0% inflation rates.
Dashmote is your ally in navigating the complexities of the digital marketplace, offering cutting-edge big data and AI analytics solutions tailored to the food and beverage (F&B) sector. Our comprehensive analysis and actionable insights empower businesses to make informed decisions and drive strategic growth in the food delivery industry. Ready to elevate your online presence and unlock new opportunities for your F&B enterprise? Get in touch with our team at contact@dashmote.com. Let's collaborate to establish a strong online presence for your business in the competitive F&B landscape.
If you found this article valuable, don't miss out on our other insightful blog posts covering topics like The Food Delivery Big Mac Index 2022 or Big Mac Around the World: A Journey Into Economics, all available on our blog.
Stay connected with us on LinkedIn @Dashmote for the latest updates and global food delivery data insights.
Pepsi has secured its position as one of the most valuable non-alcoholic beverage brand worldwide, with a brand value of €17.1 billion in 2023 [1]. As one of the biggest players in the €158.70bn European soft drink market [2], the brand’s online growth rate is also lapping its brick-and-mortar performance across Europe. Tapping into the ubiquitous at-home ordering trend, Pepsi has made substantial investments in digital channels and established strategic foodservice delivery partnerships.
The pivotal link between Pepsi and its food delivery consumer base lies in the digital menu, where the inclusion of images alongside product names has demonstrated the power to enhance consumer attitudes towards menu items, increase purchase intentions, and ultimately boost willingness to pay. This phenomenon extends to renowned beverage brands like Pepsi.
In this article, we delve into a comprehensive analysis of Pepsi's presence in the European food delivery market. Furthermore, we conducted an examination of the presence of Pepsi's images on digital storefronts selling their products, providing a compelling argument for the significance of this practice in today's dynamic consumer landscape.
Based on data from Dashmote, Pepsi has a substantial presence on food delivery platforms. However, our data also reveals that Pepsi's presence exhibits significant variation across Western European countries. France and Belgium tend to have a higher prevalence of Pepsi, with food delivery penetration rates around 10%. In contrast, Switzerland (1.4%) and Germany (3.3%) have notably lower Pepsi penetration rates on food delivery platforms.
The research findings underscore the significance of regional preferences in shaping Pepsi's market presence within the food delivery sector. However, it's crucial to emphasise that the presence of product images on the food delivery menu also plays a pivotal role in Pepsi's strategic planning and market expansion efforts.
A market report suggests that high-quality food photos can improve menu conversion rates by 25% and increase total food orders by more than 35% on food delivery platforms [3]. This phenomenon holds true not only for restaurants but also for beverage brands.
The inclusion of Pepsi images in the food delivery beverage menus provides consumers with visual cues that significantly influence their decision-making process. The product size and the packaging details can be quickly communicated to the customers, helping them better understand and engage with the offerings.
Using Pepsi images can also drive up customer traffic and help in building brand loyalty and brand recognition. The human brain retains 10% of information that it reads, but 65% of information that it sees [4]. A beverage image featuring the brand packaging is more likely to stick in the mind of potential customers, leading to sales further down the line.
These insights underscores the importance of using product images in the world of food delivery. In the next section, we delve into a detailed examination of digital menus featuring Pepsi products but lacking accompanying images. This analysis will shed light on potential areas for improvement and optimization, ensuring that Pepsi can effectively capitalise on its market opportunities.
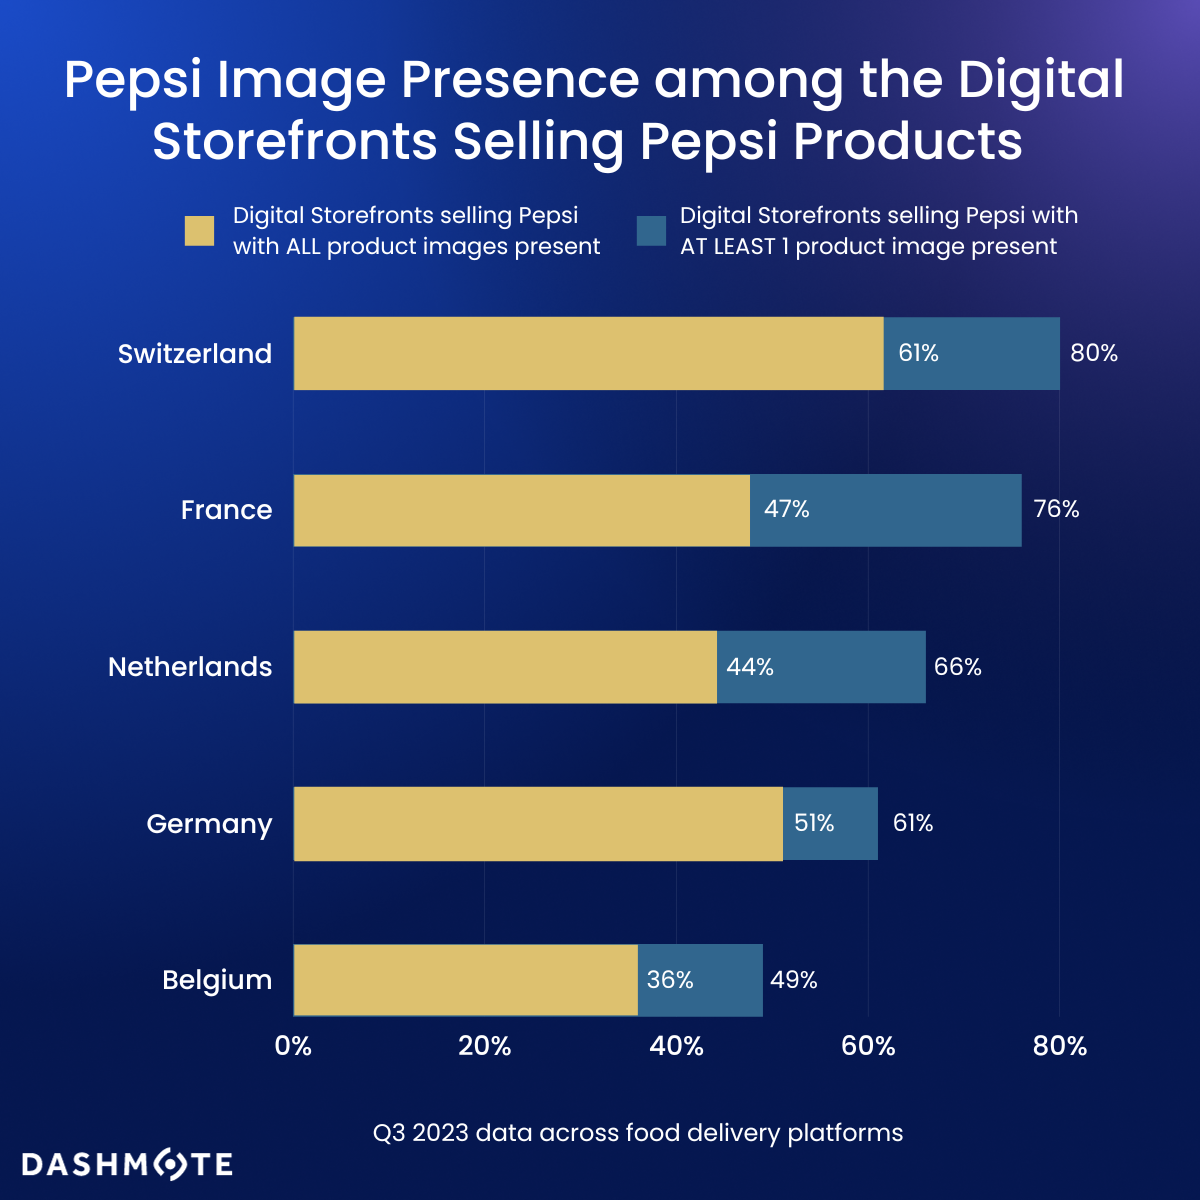
Dashmote's data reveals the presence and absence of Pepsi product images within digital storefronts that feature Pepsi offerings. These findings underscore a trend across Western European countries where Pepsi products are sometimes listed without accompanying visuals, indicating opportunities for Pepsi to enhance its online performance.
Notably, Western European countries exhibit a Pepsi image all-presence rate ranging from 27% to 61%. Switzerland stands out at the top of the list, with a striking 61% of digital storefronts selling Pepsi products having all images present, and a higher percentage of 80% featuring at least one Pepsi product image.
Following closely is France, with percentages of 47% and 76% for all Pepsi images present and at least one Pepsi image present, respectively. In Germany, 51% of digital storefronts selling Pepsi show all product images.
Conversely, the rate is the lowest in Belgium, which stands at 36%, indicating a less visually enriched Pepsi presence in this region.
Dashmote is dedicated to assisting enterprises in overcoming obstacles and achieving success in the digital market space. As the foremost provider of big data and AI analytics solutions in the food and beverage (F&B) sector, we enable companies to make informed strategic choices by offering thorough analysis and invaluable insights into the food delivery market and F&B trends. Interested in taking your online business to the next level? Feel free to reach out to our team at contact@dashmote.com. Together, we can establish a robust online footprint for your Food & Beverage enterprise.
If you find this article valuable, you may also be interested to check out more of our blog articles on Pepsi, such as the cola battles in India or the cola war in the UK.
Follow us on LinkedIn @Dashmote to stay up-to-date with the latest food delivery data insights on a global scale.
When savoring a Big Mac, one may not realize its potential as a tool for understanding global economics. In a previous article, we introduced the Food Delivery Big Mac Index, which monitored Big Mac prices on food delivery platforms across 35 countries for three quarters in 2022. This index helps us comprehend variations in purchasing power, currency value, and inflation. Building on this topic, in this new article, we focus on the last quarter of 2022 and the first quarter of 2023, analyzing how Big Mac prices have evolved worldwide. Our analysis uncovers interesting trends among countries and discusses the implications of these patterns for the food and beverage industry. To provide a comprehensive perspective on global prices and their economic relevance, we compare our findings with The Economist's Big Mac research.
In our previous article, we mentioned that the Big Mac is great for comparisons because it's widely available and consistent worldwide [1]. The index can help us understand currency values by comparing burgers in two countries, showing if a currency might be over or undervalued [2]. The Big Mac Index not only simplifies the concept of exchange rates but also shows how burger prices change over time, revealing inflation. By converting all Big Mac prices into a single currency, the index emphasizes cost differences around the world, giving insights into costs like rent, equipment, labor, and other factors.
Why is this important for those in the food and beverage industry? The Big Mac Index is relevant because it helps global companies develop pricing strategies, enabling them to adjust prices based on currency values. For example, a company may decide to charge a higher price for their product in a country with an overvalued currency, like Switzerland, compared to a country with a lower currency value, such as Indonesia.
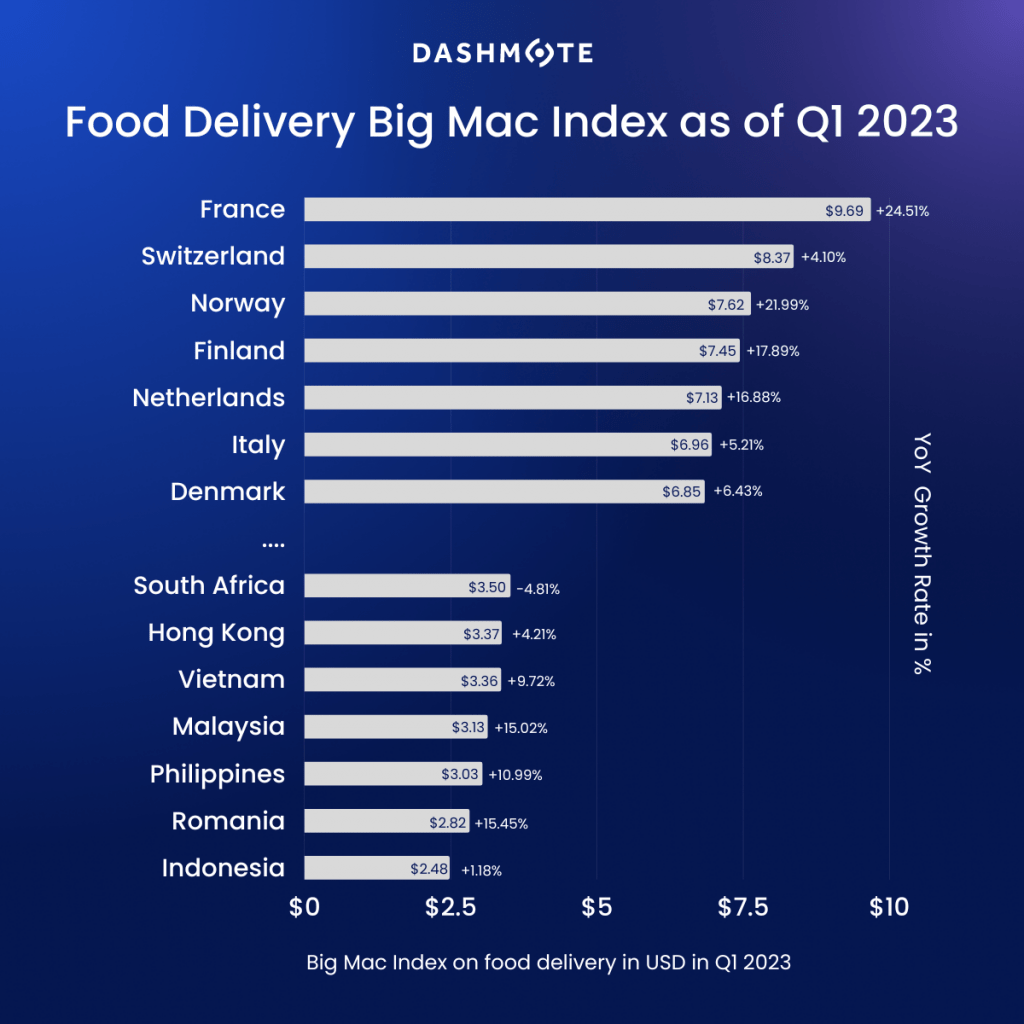
Our data showed that in Q1 2023 the maximum price of a Big Mac in France is around €8.8 ($9.66), making it one of the most expensive, while in Indonesia, the same burger is only IDR 37,130 ($2.48). This big difference shows the variety in economic conditions and buying power in different countries. The average Big Mac price worldwide is around $5.43, with prices varying greatly among countries, reflecting various factors like local production costs, taxes, and consumers' willingness to pay. This information emphasizes the importance of understanding the economic landscape when studying Big Mac prices worldwide.
Poland saw a significant 66.85% increase from Q1 2022 to Q1 2023. Its non-Euro currency, the Polish zloty, reached record lows against the euro and dollar in 2022 [3] and factors like the war in Ukraine and a deteriorating economy contributed to currency fluctuations. Turkey's Big Mac price jumped by a huge 154.63% during this time, reflecting worries about inflation and economic stability in the country. France, which already had high Big Mac prices, experienced a 24.51% increase from €7.10 in Q1 2022 to €8.84 in Q1 2023. This could mean the French economy is growing as prices usually go up when the demand for goods and services increases.
Norway, also known for high Big Mac prices, had a 21.99% increase from $6.30 in Q1 2022 to $7.61 in Q1 2023. This might indicate economic growth in Norway and a higher willingness to spend on fast food. However, since Norway had one of the highest Big Mac prices in Q1 2022, the increase could also be due to other factors, like changes in taxes or ingredient costs.
In contrast, Brazil and South Africa showed negative growth rates of -1.30% and -4.81%, signaling unique economic situations. The fast food industry has grown recently in both countries [4,5]. In Brazil, this growth is driven by a rising middle class with more disposable income. Meanwhile, South Africa's competitive hospitality sector, the largest food service market in Africa, is expected to grow despite economic challenges. The growing demand for diverse fast food options has boosted the industry in both countries.
What does The Economist [6] think about all this? They've also been tracking Big Mac prices and believe that the cost of the burger reflects wider inflation trends. Our findings match their observation that the average price of a Big Mac in the US has gone up more than 6% to $5.36 over the past two years. However, we discovered that some countries like France, Poland, and Turkey have seen even bigger price increases. This interesting Big Mac story highlights the need to understand global prices and their effects on the food and beverage industry.
For professionals in the food and beverage industry, knowing these global price trends is essential. The Big Mac Index is an easy and engaging way to compare costs across countries, helping businesses make smart decisions in a complicated economic world. The data on Big Mac price changes from Q1 2022 to Q1 2023 provides valuable insights into economic health, consumer preferences, and more, allowing industry stakeholders to make well-informed decisions regarding pricing, marketing, and other aspects of their business.
Dashmote is the leading big data and AI analytics company in the food & beverage industry. We help F&B enterprises by empowering leaders and analysts to track and analyze publicly available data to contribute to making strategic decisions for your brand. Want to know more about retrieving market insights across food delivery and F&B?
→ Please contact sales@dashmote.com.
Europe has a centuried history with food delivery. The first ever food delivery took place in the mid-19th century, Italy. King Umberto I and Queen Margherita received the first pizza delivery. Fast forward to over 100 years later, today, online food delivery has become a billion-dollar business. The European food delivery market is expected to grow with a double-digit CAGR of 10.7% from 2021 to 2027 and is projected to reach a value of US$66 billion in 2027 [1]. Moreover, user penetration is reaching 24.9% in 2022 and is expected to hit 36.5% by 2027 [2].
As online food ordering has become increasingly prevalent, aggregator platforms, such as Deliveroo, Uber Eats, Just Eat, and Wolt, are optimising everything they can, from reliable business models to appealing user experience, to win the intense race of European food delivery. In this article, we leveraged Dashmote’s Data Analytics SaaS platform and included statistics from 5 major markets - UK, France, Germany, Spain, and the Netherlands, to report on the ongoing food delivery race between major aggregator platforms in Europe.
According to Dashmote’s Q3 data, the UK has by far the biggest food delivery market in Europe. It has more than 250K Digital Storefronts (DSFs) across its major delivery platforms. Deliveroo is the most significant player in the UK in terms of market share and growth. It take up around half of the total restaurant base in the UK.
The second largest market in Europe is France, with 137K DSFs on food delivery. Uber Eats is its biggest player, occupying 44% market share in Q3, 2022. Surprisingly, the year-to-date growth of restaurant listings of Uber Eats (8%) is significantly lower than the 2nd biggest player Deliveroo (26%) and 3rd biggest player Takeaway (23%). With its fast-growing peers, it will be difficult for Uber Eats to remain the game leader in France.
Spain ranks 3rd in the race with 100K DSFs on its food delivery. In Spain, Glovo, with 48K DSFs, is the biggest aggregator platform in terms of restaurant listing. However, Just Eat, with the highest year-to-date growth rate of 28%, is quickly catching up. Uber Eats performs well in many countries, but not in Spain. In Spain, it has the smallest restaurant base and lowest year-to-date growth rate (9%) in 2022, compared to Glovo (11%) and Just Eat (28%).
Uber Eats Germany saw a staggering year-to-date growth rate of 64%. This is not mistaken. In fact, Uber is growing its German delivery business and plans to include 70 cities by the end of the year, expanding from its roster of 14 cities in March 2022 [3]. Our data clearly reflects this expansion. Moreover, Wolt Germany also had a large year-to-date growth of 48%. Entering Germany in 2020, Wolt has now expanded to 10 cities and made Germany one of its key markets. In March 2022, Wolt opened a new office in Berlin. As of June 1st, 2022, DoorDash officially acquire Wolt. Despite a lot of changes this year, Wolt is succeeding in its expansion in Germany in terms of restaurant listings, as evidenced by our data.
The intense race between aggregator platforms in the ever-changing landscape of European food delivery brings enormous opportunities for food and beverage brands to expand digitally and reach a wider consumer. Unlocking these opportunities requires constant tracking and analysing the latest data to gain a sophisticated understanding of where the market is heading. Dashmote is the leading big data and AI analytics company in the food & beverage industry. We help F&B enterprises by empowering leaders and analysts to track and analyse publicly available data to contribute to making strategic decisions for your brand. Do you want to see the same research carried out on Southeast Asia? Check out HERE. Do you want to know more about retrieving market insights across food delivery and F&B?
→ Please contact sales@dashmote.com.
Uber Eats is an online food ordering and delivery platform that was launched by Uber back in August 2014. It originally began in California as one of the experimental services UberFRESH to deliver convenience-store items. One year later, the platform was renamed Uber Eats. For the first time, the company has broken a product out into its own standalone app. Since then, the company has come a long way to become a significant representation of the modern digital culture. During the Covid pandemic, it had a 70% increase in gross booking and drove more than 50% of the total revenue of Uber in 2021[1]. Today, it operates in over 6,000 cities across 45 nations, and it is continuously expanding.
Few companies (Google, Amazon, Apple) can compete well in two markets at the same time. Uber has won the ride-hailing market in terms of market share. Is the company doing just as well in the food delivery market? During Uber’s recent Q3 earnings call, the company reported a revenue growth of $8.3 billion, which increased 72% YoY. Among that, Mobility Revenue grew 73% YoY and 8% QoQ to $3.8 billion, and Delivery revenue grew 24% YoY and 3% QoQ to $2.8 billion [2]. Unarguably, the solid earnings prove that Uber Eats, with over 81 million users world-widely, is succeeding in the food delivery industry [3].
In this article, we conduct an Uber Eats case study on a global scale. By leveraging Dashmote’s Data Analytics SaaS platform, we summarised a number of key features on this platform around the globe. It includes the growth of digital storefronts in Q3, the most popular cuisine types, and the top-listed beverage brands. After reading the article, you will gain a more sophisticated understanding of the general popularity of Uber Eats, and its current food and beverage trends.
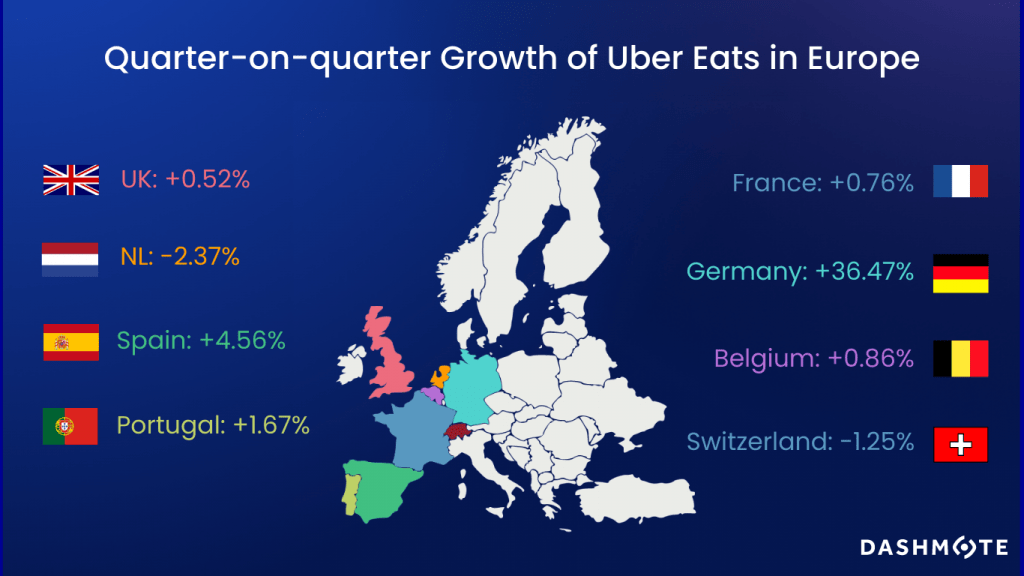
According to our Q3 food delivery data, the growth in Uber Eats‘ digital storefronts in major European countries has been slowing down. Uber Eats NL and Switzerland saw a quarter-on-quarter decrease in restaurant listings on its platform. Belgium and France grew by less than 1%. In the UK, after a double-digit growth of 10.75% in Q2, the growth in restaurant listings decreased dramatically to 0.52% in Q3. However, in Germany, it saw a staggering QoQ growth of 36.47%. This is not mistaken. In fact, the company is growing its German delivery business and plans to include 70 cities by the end of the year, expanding from its roster of 14 cities in March 2022 [4]. Our data clearly reflects this expansion.
Uber Eats is the 2nd biggest food delivery platform in the U.S., controlling over 25% of the food delivery market [5]. Our data shows that the U.S. remained the company’ largest market. It has around 450k restaurants listed on its platform and a QoQ growth of 1.85%. This restaurant base is 4 times the size in Japan.
According to Dashmote’s data, fast food, burger, and American cuisine are the dominating choices across the largest markets for Uber Eats. In NZ, Asian food ranked as the 3rd most listed cuisine type after fast food and burger.
One would expect Uber Eats France to showcase some French cuisine. Mistakenly, burgers, American, and fast food make up the top 3 cuisines in France. Moreover, Italian cuisine has been ruling the world for the last decades, but not on Uber Eats. Italian food, such as pasta and pizza, did not make it to the top 3 for most of the major countries where Uber Eats operates in.
A key takeaway from this data is that global consumers increasingly value convenient and fast food, and a key aspect driving the food delivery industry is the fast and busy life of people. Understanding the key trends on Uber Eats will benefit your business in adapting to consumer demands and discovering opportunities in the market.
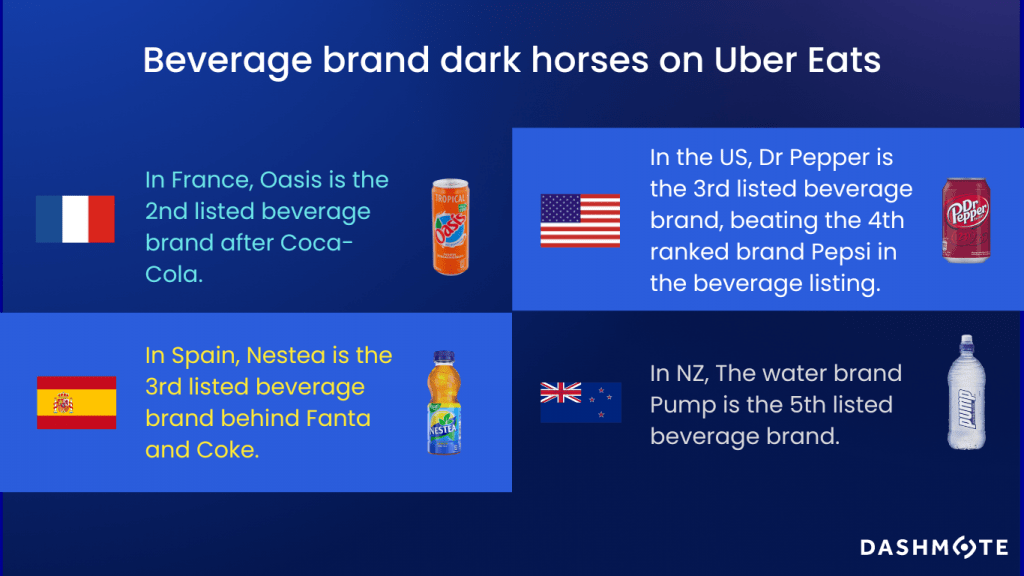
Our data shows that Coca-Cola remained the biggest beverage brand on Uber Eats across all major markets. In the US and the UK, Coca-Cola is now around double the size of Pepsi in terms of brand listing. Sprite and Fanta make it to the top 5 listed brands for most of the countries that are in scope. Moreover, we discovered some dark horses in the top listed beverage brands in some major countries, as shown in the visual below.
Overall, Uber Eats, along with the online food delivery industry, has witnessed an immense expansion since the pandemic began. However, our data shows that the market growth, in terms of restaurant listings, has been slowing down in Q3 2022. This can be also reflected in Uber's Q3 revenue reports, where Delivery revenue grew 24% YoY but only 3% QoQ.
After all, Uber Eats is still a success story in the food delivery industry with growing popularity. Understanding the food and beverage trends on the platform is essential for companies that can expand into the aggregator territory. Dashmote is the leading big data and AI analytics company in the food & beverage industry. We help F&B enterprises by empowering leaders and analysts to track and analyse publicly available data to contribute to making strategic decisions for your brand. Do you want to know more about retrieving market insights across food delivery and F&B?
→ Please contact sales@dashmote.com.
Introduced in 1967 by a McDonald’s franchise owner Jim Delligati, the Big Mac today can be purchased in over 100 countries. Despite not being confirmed by McDonald’s, an estimated 900 million Big Macs are sold yearly around the globe, which means that an average of more than 2.4 million sold daily [1]. While you are enjoying the same tasty ingredients, the cost of a burger varies depending on which part of the world you are in, as evidenced by the Big Mac Index.
The Big Mac Index was invented by The Economist in 1986 as a lighthearted guide to demonstrate the concept of purchasing power parity [2]. Although it is not a precise gauge of currency alignment, it helps illustrate the idea that the market exchange rates could be at an “incorrect” level when compared to the cost of buying the same basket of goods or services in two countries. Big mac has the advantages of having widespread availability and the same inputs and distribution system globally [3]. Comparing the prices of the burger in two countries, the index can give an indication as to whether a currency may be over or undervalued [4].
Beyond being a tool that makes exchange-rate theory more digestible, the Big Mac index also shows inflation in burger prices over time. By converting all Big Mac prices into the same currency, it also indicates the differences in burger cost around the world that shed light on the cost of renting space and equipment, labour, and other factors. By leveraging Dashmote’s data analytics platform, we tracked prices of Big Mac’s on food delivery platforms in 35 countries across three quarters in 2022. In this article, we give insights into both relative prices and price trends of Big Mac around the globe.
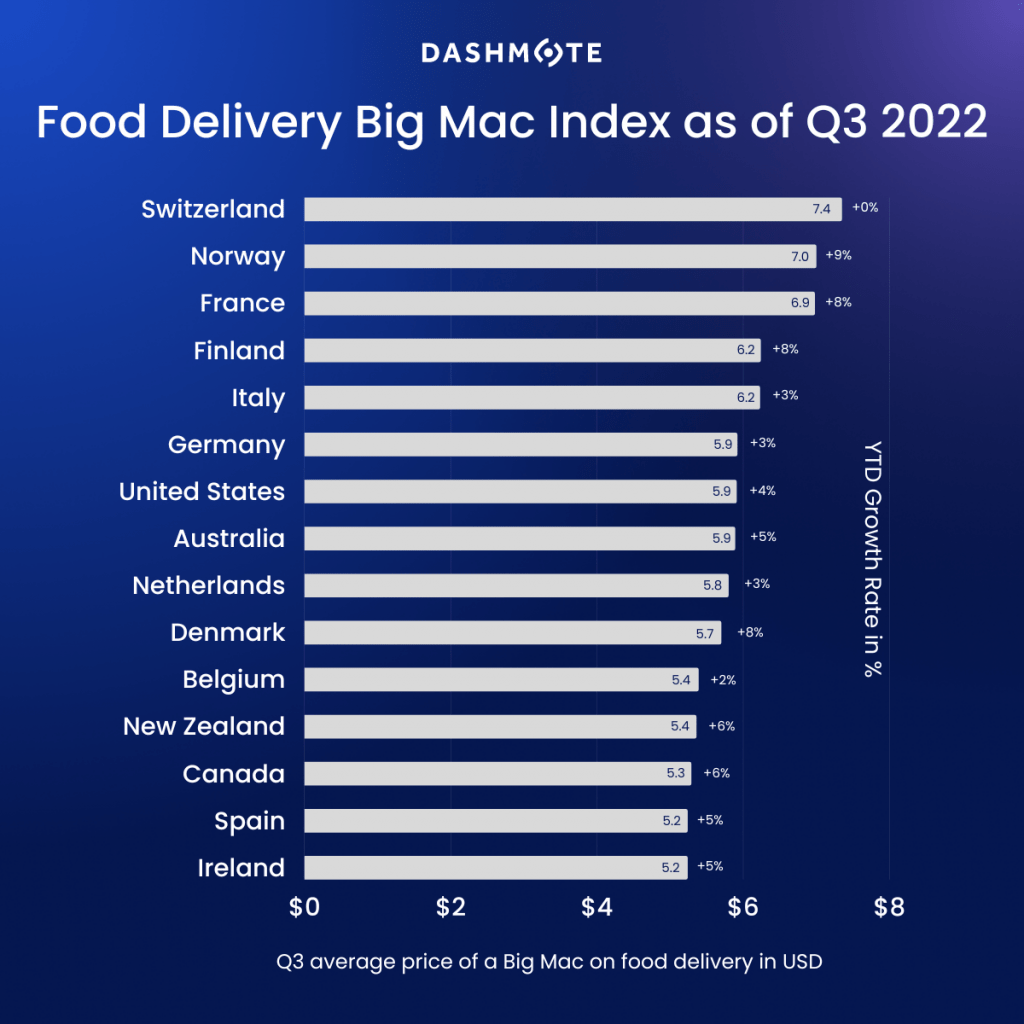
According to Dashmote’s ‘Food Delivery Big Mac Index’ data, there are no food delivery pricing guidelines for McDonald’s franchisees. In France, the prices of a Big Mac are the most diverse, which varies from US$5.4 to US$8.9.
Switzerland has the priciest burger at a cost of US$7.4, followed by Norway at US$7.0. Both countries are in Northern Europe where both living costs and wages are relatively high compared to other parts of the world. Considering that a Big Mac averagely costs 7.35 francs on food delivery in Switzerland, the USD/CHF rate expressed in the Big Mac Index terms should be 1.23 francs per dollar. However, the value of this pair is currently quoted around 1.01 in Forex, which makes the Swiss currency overvalued by the market by 21.8%.
Unsurprisingly, India has the cheapest Big Mac at US$2, making Indian Rupee the most undervalued currency in the above listed countries according to the Big Mac Index. It’s important to note that Big Macs in India are made of chicken patties instead of beef, which makes it less comparable to other countries. However, having a Big Mac that only costs ⅓ of it in the USA still indicates the low-wage labour market in India.
A Big Mac on Indonesian food delivery costs US$2.3 on average, indicating the undervalue nature of Indonesian rupiah. An Indonesian tourist ordering food when visiting the USA will be paying more than double the price for the same Big Mac back home.
Turkey has seen the largest jump in burger prices, with the cost of a Big Mac climbing over 60% since the beginning of 2022. The annual inflation rate in Turkey rose further to 85.5% in October 2022, from 83.5% in the previous month [5]. This highest inflation rate since June of 1998 explains the large price swings for a Big Mac in Turkey in 2022.
The price of Big Macs on food delivery in Greece also grew significantly from US$3.8 in Q1 2022 to US$4.9 in Q3, with a 30% increase. The following is Turkey (+18%), and eastern European countries Poland and Hungary (+11%). The delivery price of a Big Mac grew the least in Switzerland (+0%) and United Arab Emirates (+1%).
The ‘Food Delivery Big Mac index’ offers global organisations a good perspective to take into consideration when making their go-to-market pricing strategies. For example, a Dutch organisation might decide that they can sell their product at a higher price in countries with an overvalued currency, such as Switzerland and Norway. Among similar lines, a company can sell a product at a lower price in countries with an undervalued exchange rate, like India, but potentially at a larger quantity. By giving insights on purchasing power parity, labour costs, inflation and so on, the Big Mac Index simplifies the complex economic theory through the price of a burger.
Dashmote is the leading big data and AI analytics company in the food & beverage industry. We help F&B enterprises by empowering leaders and analysts to track and analyse publicly available data to contribute to making strategic decisions for your brand. Do you find the ‘Food Delivery Big Mac Index’ interesting? Do you want to know more about retrieving more market insights across food delivery and F&B?
→ Please contact sales@dashmote.com.
The quick-service restaurant (QSR) industry has been witnessing a revolutionary trend as consumers reduce dining in and utilise delivery options. Something that was initially popularised due to the pandemic seems to be sticking around. The global restaurant operators are also taking notice of it. In McDonald’s third-quarter earnings report, CEO Chris Kempczinski emphasised a digital momentum. He mentioned that digital sales now represent over one-third of systemwide sales in McDonald’s top six markets. This signifies the importance for QSRs to partner with delivery platforms to open up additional channels for consumers to access their ‘Happy Meal’ or ‘Whopper’.
As one of the top six markets of McDonald’s according to FoodService[1], Australia is also one of the biggest countries for food delivery with the most number of digital storefronts (DSFs*). In Australia, the revenue in the Online Food Delivery segment is expected to show an annual growth rate (CAGR 2022-2027) of 8.12%, resulting in a projected market volume of US$3.17bn by 2027[2]. In this article, we investigate the top QSRs in the Australian food delivery market. We aim to provide insights into the market shares and growths of these key players.
DSFs*: A DSF refers to the digital representation of a business on a food delivery platform.
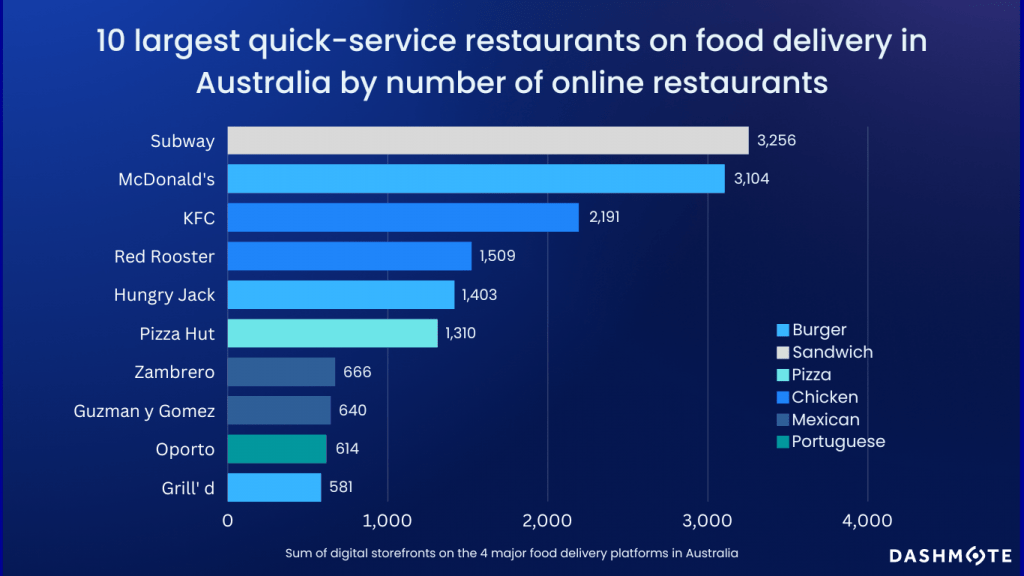
Our data reveals the top 10 QSRs on food delivery in Australia. Subway and McDonald’s are competing to be the biggest QSR — both brands have around 3K DSFs on Australian food delivery across Uber Eats, Just Eat, DoorDash, and Deliveroo. KFC, Red Rooster, and Hungry Jacks - an Australian fast food franchise of the Burger King Corporation, make up the rest of the top five brands. It’s important to note that McDonald’s, KFC, and Pizza Hut all have self-managed delivery infrastructure parallel to their presence across food delivery platforms, which to some extent might affect their strategies on these external platforms. As you can see, Domino’s is not in the top 10 since they are delivering 100% via their own infrastructure.
The top 10 QSRs on food delivery in Australia have diverse cuisine types, bringing a variety of options to Australian consumers. Burger is the most common cuisine type within the top 10 QSRs, followed by chicken and Mexican food. While the pandemic boosted the food delivery industry, the breadth of offerings becomes a key consideration that determines which brands win or lose as the industry develops. Pizza Hut’s digital co-brand WingStreet recently partnered with DoorDash in July 2022 to bring greater availability in offerings to its Australian consumers. This extension of the menu contributes to the success of the brand in Australia.
These days, it’s important for QSRs to treat off-premises guests with the same level of care and attention as those who dine inside. Achieving No.1 in YouGov’s 2022 Dining and QSR rankings in Australia[3], Subway is updating all their consumer-facing channels to enhance its feedback mechanism[4]. Among similar lines, McDonald’s has been investing in mobile-driven marketing solutions to drive digital engagement among off-premises consumers. Pizza Hut also invests largely in technology and food delivery, which has enabled the company to reduce its delivery time by 40%. By teaming up with food delivery platforms, QSRs can provide greater availability and care for their off-premises consumers.
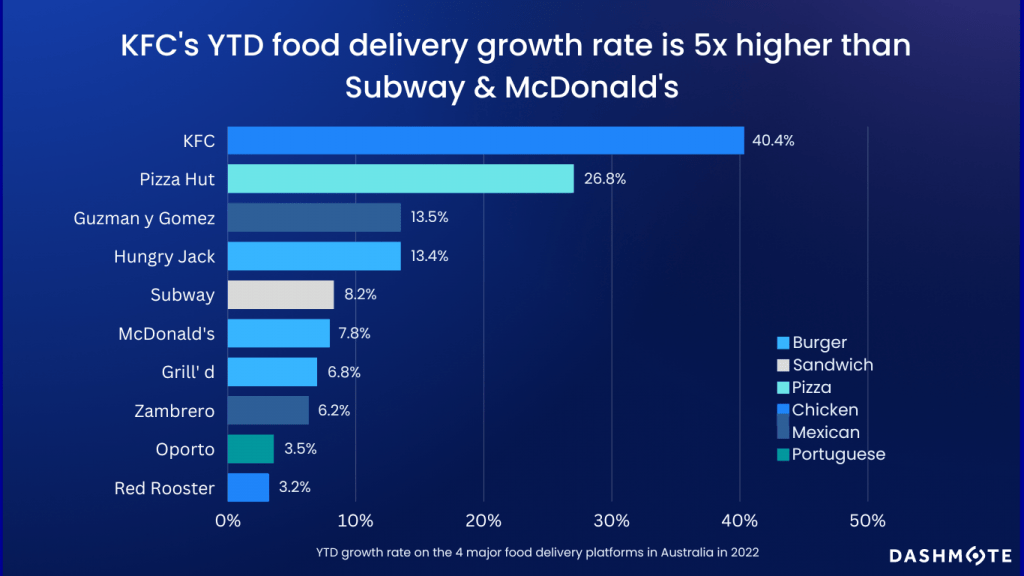
Our data shows that there is rapid growth for most of the top 10 QSRs on food delivery in Australia in 2022. Due to a new partnership with Uber Eats in Q2 2022, the growth rate of KFC increased the most by 40.4%, which was around five times more than McDonald’s and Subway. Moreover, Pizza Hut also had a distinct increase in the number of DSFs on food delivery due to the push of WingStreet on the DoorDash platform. Overall, the remarkably stable growth of top QSR brands across three quarters in 2022 implies the dominance of fast-food franchise outlets on delivery platforms in Australia.
Today’s QSR is a multi-faceted and complicated business due to the change in consumer habits during the pandemic. Even after the lift of most COVID-19 restrictions, the popularity of ordering food online hasn’t stopped. More than just recovering from the pandemic crisis, QSR businesses, such as Subway and McDonald’s, are growing significantly again, especially in digital sales. To win the food delivery game, QSRs need to strategically partner with major platforms to increase the accessibility of the outlets in the integrated digital ecosystems. It’s essential for restaurants to keep tracking the performances of their own brands as well as their competitors to determine the next strategy.
Dashmote is the leading big data and AI analytics company in the food & beverage industry. We help F&B enterprises by empowering them to track and analyse publicly available data to making strategic decisions. Are you interested in retrieving market insights across food delivery and F&B?
→ Please contact sales@dashmote.com.
Global ice cream brands are competing in a market valued at USD 79.0 billion in 2021 which is expected to expand at a compound annual growth rate (CAGR) of 4.2% from 2022 to 2030 [1]. To make sure consumer demand doesn’t melt away, manufacturers have been striving to increase their product range by introducing new ice cream varieties, such as natural, organic ingredients and exotic flavours. Along with product premiumization and innovations, major ice cream brands are also seeking to expand their digital footprint by teaming up with food delivery apps to promote and deliver their products. In this article, we analyse the top ice cream brands on food delivery in the UK and US.
Food delivery apps allow consumers to fulfil their cravings and have their favourite sweet treats delivered right to their doorstep in minutes. Nowadays, an increasing number of stores sell desserts online. Our data reveals that 45% to 50% of digital storefronts (DSFs) sell desserts on a food delivery platform in the UK. In the US, the percentage of DSFs selling desserts on three major food delivery platforms varies from 39% to 42%.
Studies have shown that ice cream is the most popular choice of dessert when ordering online[2]. Adding ice cream to online menus can not only increase average order value but also enhance visibility on the delivery platforms. It is reasonable to predict that ice cream will become an increasingly essential player in the food delivery market.
Unilever is leading the market on food delivery, they own winning brands such as Ben & Jerry’s and Magnum. Ben & Jerry’s is dominating the market on food delivery platforms in both the UK and the US, followed by Haagen Dazs and Magnum. In the UK, the number of DSFs across three platforms selling Ben & Jerry’s is particularly outstanding - it is around three times more than the second-listed brand Haagen Dazs and third-listed brand Magnum.
In the US food delivery market, the penetration rate of ice cream is much lower. Around 3% of DSFs across Doordash, Grubhub, and Uber Eats sell Ben & Jerry’s, which is approximately 30% more than Haagen Dazs, and around three times more than Magnum. Uber Eats makes the largest distribution to the US market by having the most number of DSFs selling Ben & Jerry’s and Haagen Dazs.
It's no surprise that CPG giants like Unilever are expanding to digital channels and scaling up partnerships with food delivery companies to enrich brand portfolios and seek growth opportunities. However, with a high penetration rate for desserts but a low penetration rate for ice cream, brands should continue to invest in digital space in the US, as there’s still ample room for growth.
Although Unilever is dominating the ice cream markets in both the UK and the US, the penetration rate in the US is much lower than in the UK. With e-commerce channels growing rapidly there are still plenty of opportunities for ice cream brands to expand digitally and have their products reach a wider target market through food delivery online. CPG companies need to stay on top of their game, and follow trends across the market.
Dashmote understands that need, and helps F&B enterprises by empowering leaders and analysts to track and analyse publicly available data to help you make strategic decisions for your brand. Do you want to know more about the snacks market on food delivery? Check out our chips and chocolates article. Are you interested in retrieving market insights across food delivery and F&B?
→ Please contact sales@Dashmote.com.
The US is the second largest food delivery market (behind China) globally. BusinessWire indicated that the US online food delivery market reached a value of 23.4 Billion USD in 2021, and it is expected to reach 42.6 Billion USD by 2027 [1], with an annual growth rate (CAGR 2021 – 2027) of 10.5%. By analysing data from the three main delivery platforms - DoorDash, Uber Eats, and Grubhub, we are excited to provide insights into the US food delivery market.
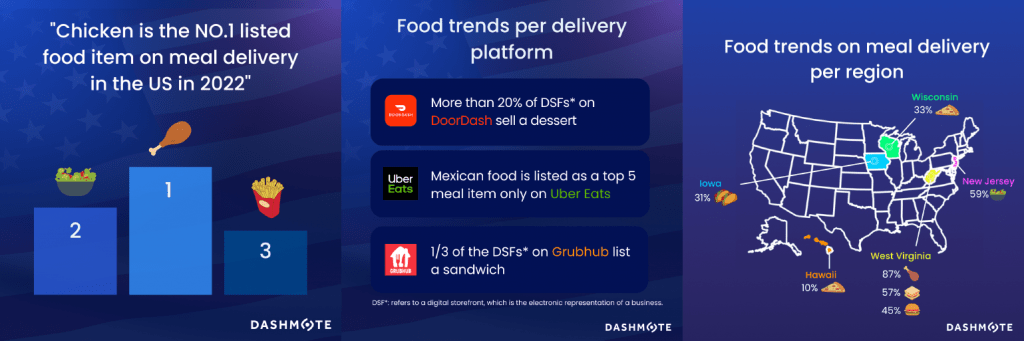
Our data reveals that chicken, salads, and fries are the top three most listed food items on food delivery in the US. Out of more than 1.3 million Digital Storefronts (DSFs*) in the US by August 2022, around 75% of all DSFs listed chicken, 50% listed salads, and 46% listed fries.
*A DSF refers to the electronic representation of a business on a food delivery platform. A business can be listed on three different food delivery platforms (e.g. DoorDash, GrubHub and Ubereats), in our data that would be counted as three DSFs and one outlet.
Our data shows that all three platforms value ease and convenience, and the top listed foods vary very slightly between these platforms. Specifically, 40% of all DSFs* on DoorDash list sandwiches, 1/3 of the DSFs on Uber Eats list rice dishes, and Grubhub has the highest % of DSFs listing desserts. Understanding the key trends and overall characteristics of food delivery platforms will benefit your business in discovering the opportunities in the market.
In the United States, West Virginia has the highest percentage of DSFs listing chicken dishes, sandwiches and burgers. New Jersey has the most DSFs listing salads. Iowa has over 1/3 of DSFs selling taco. Pizza is most popular in Wisconsin. Interestingly, Hawaii has the lowest percentage of DSFs listing pizza, which is only 10%.
Platforms such as DoorDash, Uber Eats, and Grubhub have widely opened the delivery space in the US, making it significantly easier for businesses of all sizes to sell their product online and have it delivered straight to customers. Unlocking opportunities in the complex ecosystem of the US food delivery industry requires constant tracking and analysing the latest data to gain a sophisticated understanding of where the market is heading.
If you are looking for more data insights, or interested in collaborations, please contact sales@dashmote.com.