Cracking the code of Uber Eats:
A case study
Uber Eats is an online food ordering and delivery platform that was launched by Uber back in August 2014. It originally began in California as one of the experimental services UberFRESH to deliver convenience-store items. One year later, the platform was renamed Uber Eats. For the first time, the company has broken a product out into its own standalone app. Since then, the company has come a long way to become a significant representation of the modern digital culture. During the Covid pandemic, it had a 70% increase in gross booking and drove more than 50% of the total revenue of Uber in 2021[1]. Today, it operates in over 6,000 cities across 45 nations, and it is continuously expanding.
Few companies (Google, Amazon, Apple) can compete well in two markets at the same time. Uber has won the ride-hailing market in terms of market share. Is the company doing just as well in the food delivery market? During Uber’s recent Q3 earnings call, the company reported a revenue growth of $8.3 billion, which increased 72% YoY. Among that, Mobility Revenue grew 73% YoY and 8% QoQ to $3.8 billion, and Delivery revenue grew 24% YoY and 3% QoQ to $2.8 billion [2]. Unarguably, the solid earnings prove that Uber Eats, with over 81 million users world-widely, is succeeding in the food delivery industry [3].
In this article, we conduct an Uber Eats case study on a global scale. By leveraging Dashmote’s Data Analytics SaaS platform, we summarised a number of key features on this platform around the globe. It includes the growth of digital storefronts in Q3, the most popular cuisine types, and the top-listed beverage brands. After reading the article, you will gain a more sophisticated understanding of the general popularity of Uber Eats, and its current food and beverage trends.
Uber Eats 2022 Q3 digital storefronts growth
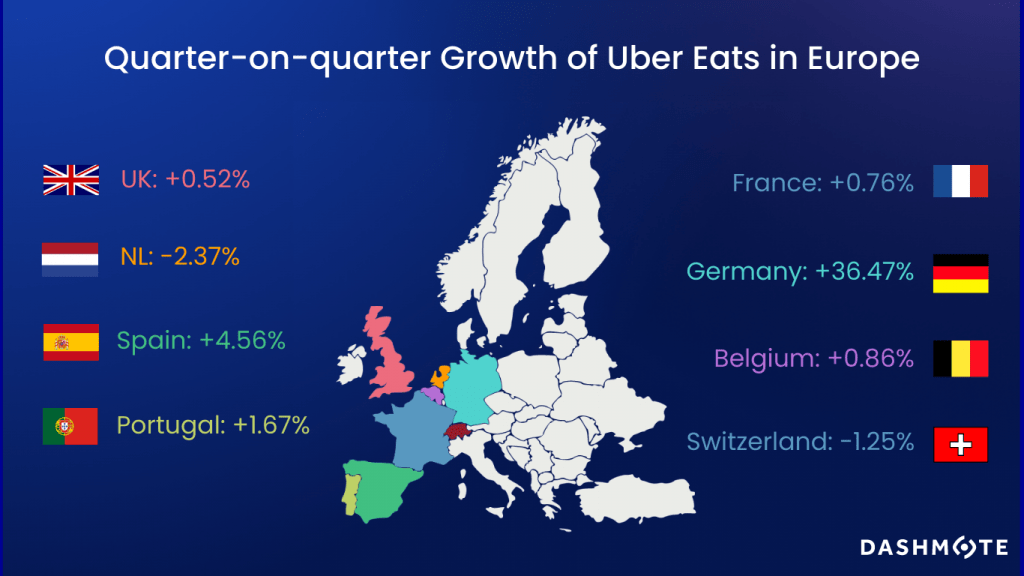
According to our Q3 food delivery data, the growth in Uber Eats‘ digital storefronts in major European countries has been slowing down. Uber Eats NL and Switzerland saw a quarter-on-quarter decrease in restaurant listings on its platform. Belgium and France grew by less than 1%. In the UK, after a double-digit growth of 10.75% in Q2, the growth in restaurant listings decreased dramatically to 0.52% in Q3. However, in Germany, it saw a staggering QoQ growth of 36.47%. This is not mistaken. In fact, the company is growing its German delivery business and plans to include 70 cities by the end of the year, expanding from its roster of 14 cities in March 2022 [4]. Our data clearly reflects this expansion.
Uber Eats is the 2nd biggest food delivery platform in the U.S., controlling over 25% of the food delivery market [5]. Our data shows that the U.S. remained the company’ largest market. It has around 450k restaurants listed on its platform and a QoQ growth of 1.85%. This restaurant base is 4 times the size in Japan.
Popular Cuisine types on Uber Eats
According to Dashmote’s data, fast food, burger, and American cuisine are the dominating choices across the largest markets for Uber Eats. In NZ, Asian food ranked as the 3rd most listed cuisine type after fast food and burger.
One would expect Uber Eats France to showcase some French cuisine. Mistakenly, burgers, American, and fast food make up the top 3 cuisines in France. Moreover, Italian cuisine has been ruling the world for the last decades, but not on Uber Eats. Italian food, such as pasta and pizza, did not make it to the top 3 for most of the major countries where Uber Eats operates in.
A key takeaway from this data is that global consumers increasingly value convenient and fast food, and a key aspect driving the food delivery industry is the fast and busy life of people. Understanding the key trends on Uber Eats will benefit your business in adapting to consumer demands and discovering opportunities in the market.
Top listed beverage brands on Uber Eats
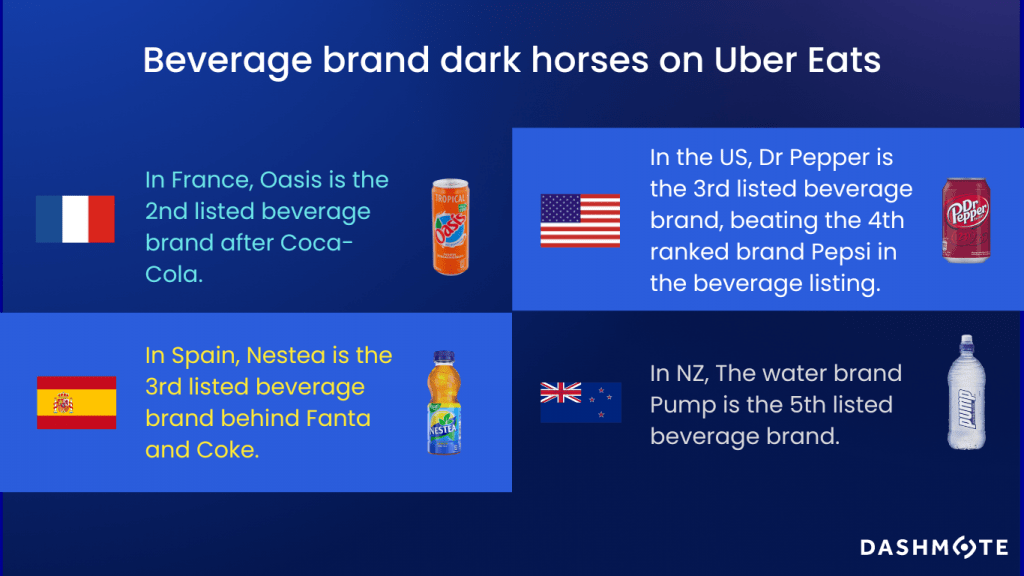
Our data shows that Coca-Cola remained the biggest beverage brand on Uber Eats across all major markets. In the US and the UK, Coca-Cola is now around double the size of Pepsi in terms of brand listing. Sprite and Fanta make it to the top 5 listed brands for most of the countries that are in scope. Moreover, we discovered some dark horses in the top listed beverage brands in some major countries, as shown in the visual below.
Overall, Uber Eats, along with the online food delivery industry, has witnessed an immense expansion since the pandemic began. However, our data shows that the market growth, in terms of restaurant listings, has been slowing down in Q3 2022. This can be also reflected in Uber's Q3 revenue reports, where Delivery revenue grew 24% YoY but only 3% QoQ.
After all, Uber Eats is still a success story in the food delivery industry with growing popularity. Understanding the food and beverage trends on the platform is essential for companies that can expand into the aggregator territory. Dashmote is the leading big data and AI analytics company in the food & beverage industry. We help F&B enterprises by empowering leaders and analysts to track and analyse publicly available data to contribute to making strategic decisions for your brand. Do you want to know more about retrieving market insights across food delivery and F&B?
→ Please contact sales@dashmote.com.