The popularity of vegan and vegetarian cuisine has been steadily increasing for years. People are consuming less meat and other animal products such as eggs and dairy. Many reduce their consumption for animal welfare or environmental reasons, while others do so for health benefits. As a result, more people are opting for plant-based options.
This trend is expected to continue growing. For example, in the 1980s, vegetarianism and veganism were considered extreme, and there were very few plant-based options available. Today, the variety of plant-based products has expanded dramatically. According to reports by PETA, by 2050, more than 25% of the animal meat market is expected to be the vegan market, that is, the plant-based market.
We analyzed DoorDash, Ubereats, Justeats, Wolt, Takeaway, Foodora and Deliveroo in a period of one year in six veg-friendly countries—Australia, Germany, Spain, Italy, Sweden, and the United Kingdom—to see how this trend is reflected in food delivery platforms.
When looking at the number of vegan and vegetarian digital storefronts in these five countries, the UK stands out. The UK takes the lead with 48,535 vegan or vegetarian storefronts on digital platforms. This dominance is also reflected in the number of vegan or vegetarian digital storefronts per 10,000 inhabitants in the UK, which is 7.1. Australia follows with 4.1, and Sweden with 1.5 digital storefronts per 10,000 people. Germany and Spain trail with 0.5 and 0.6 vegan or vegetarian restaurants per 10,000 inhabitants, respectively.
Even though the UK has the most vegan and vegetarian options, Germany has seen the largest increase in the number of vegan and vegetarian digital storefronts in the past year. In Germany, the number of digital storefronts grew from 4,800 in 2023 to 6,400 in 2024, marking a significant 33% increase. Australia follows with a 13% increase, and Italy is close behind with a 12% rise. In contrast, the UK shows a small growth of just 0.5%.

When we look at the proportion of vegan and vegetarian restaurants compared to the total number of digital storefronts, the UK still leads the pack. But there's been a drop from 18.6% in 2023 to 15.5% in 2024. The only country where this share has slightly gone up is Sweden.
Looking at the total number of digital storefronts on food delivery platforms, this number is increasing relatively faster than the number of vegan/vegetarian restaurants.

Despite the growing interest in vegan and vegetarian diets, there can be a few reasons why we don't see more of these restaurants on food delivery apps:
Market Demand and Size, despite the increasing popularity, the vegan and vegetarian market is still relatively small compared to the overall food market. In many places, there simply isn't enough demand for vegan and vegetarian options to support a large number of restaurants dedicated solely to these diets. Also, many people still prefer traditional diets with meat and animal products, which means there's a bigger customer base for regular restaurants.
Restaurant Conversion and Menu Limitations, many restaurants on digital storefronts offer vegan and vegetarian dishes as part of their menu expansion. However, they often do not convert to fully vegan or vegetarian menus and, therefore, are not classified as entirely vegan or vegetarian. This leads to an underrepresentation of fully vegan or vegetarian restaurants on food delivery apps and are also not taken into account in this research.
Economic and Visibility Challenges, it can be less attractive for vegan and vegetarian restaurants to be listed on food delivery platforms for a few reasons. They often have to pay more for specialty ingredients, which can be pricier than regular ones. Also, smaller vegan and vegetarian restaurants might not have much money to spend on advertising, making it harder for them to get noticed on these apps and attract customers.
While vegan and vegetarian cuisine gains popularity, its presence on food delivery platforms encounters challenges. Even though the UK has the most listings, the proportion of vegan and vegetarian options has gone down. Similarly, in Germany, although there are more listings, the share of vegan and vegetarian restaurants hasn't changed much. The only country where we notice a small increase in market share is Sweden. Barriers for vegan or vegetarian restaurants can be the small size of the niche market and financial constraints are holding back wider representation.
We also have to take into account that only restaurants that are fully vegetarian or vegan are listed on food delivery apps and that other restaurants that offer a wider range than vegan or vegetarian are excluded from this research. The amount of vegan or vegetarian restaurants are not growing, but possibly the overall vegan food options are..
Dashmote assists enterprises in overcoming obstacles in the digital market space. As the foremost provider of big data and AI analytics solutions in the F&B sector, we enable informed strategic choices. Reach out to our team at contact@dashmote.com to establish a robust online footprint.
Follow us on LinkedIn @Dashmote to stay up-to-date with the latest food delivery data insights globally.
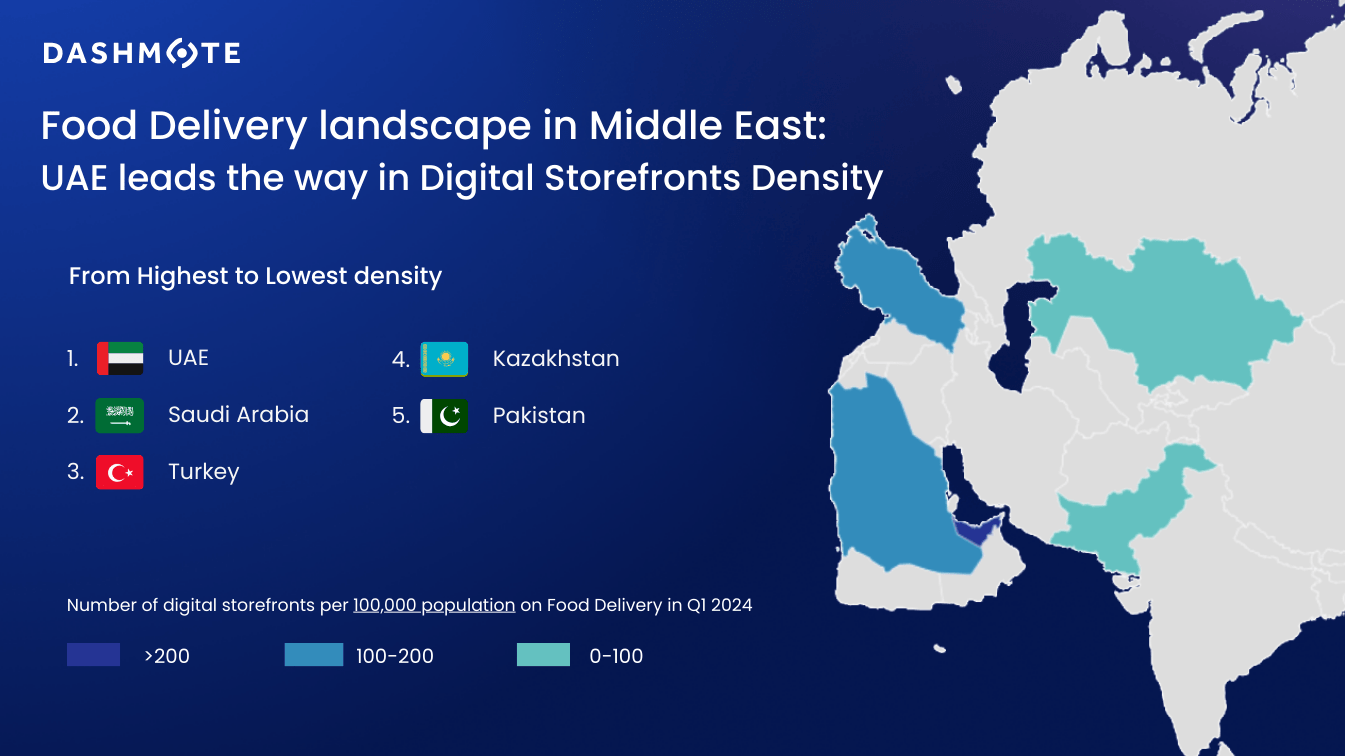
In today’s article, we wanted to shift focus from Europe, and dive into some of the Middle Eastern markets, analyzing key trends and platform performance across Turkey, Pakistan, Kazakhstan, Saudi Arabia, and the UAE.
These five markets combined are projected to reach a CAGR (2024-2029) of 10.4% on average, and they will likely hit US$25bn in revenue by 2029. [1]
The analysis was made based on the top platform from each country: Yemeksepeti (Turkey), Talabat (UAE), Foodpanda (Pakistan), Hungerstation (Saudi Arabia) and Glovo (Kazakhstan).
For a better comparison of Food Delivery density across these markets, we’ve analyzed the number of digital storefronts per 100,000 habitants.
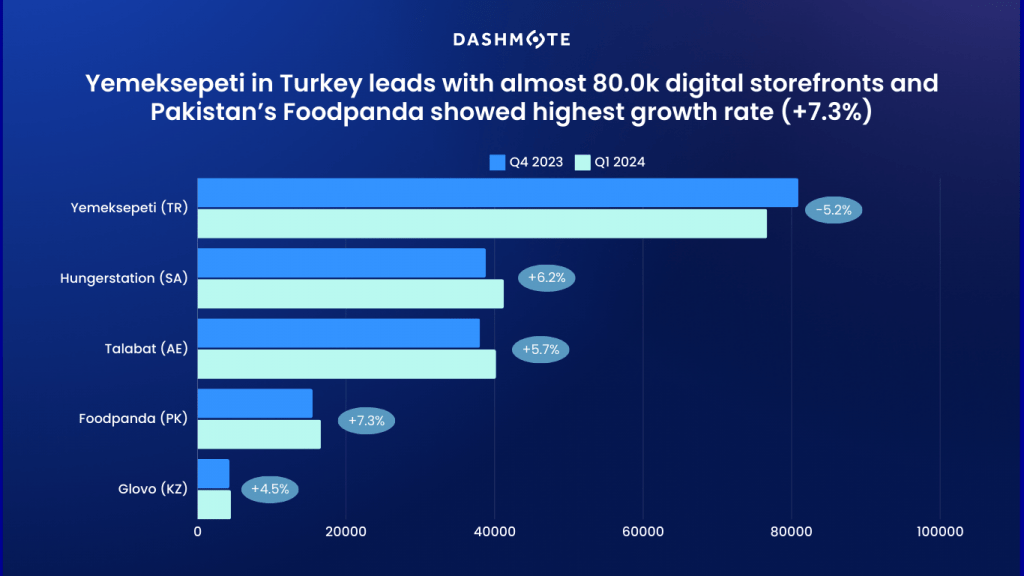
Now that we understand the concentration of Food Delivery services, how can we expect these numbers to change in the future? We looked into the growth of digital storefronts in each platform over the past quarter.
Key takeaways
- Yemeksepeti in Turkey is the biggest platform in number of digital storefronts (DSFs), but it slightly declined with -5.2% from Q4 to Q1 (going from 80.9k to 76.6k DSFs)
- Pakistan leads regional growth, showing a +7.3% increase in digital storefronts (DSFs) from Q4 2023 to Q1 2024, from 15.4k to 16.6k on the Foodpanda platform
- The UAE and Saudi Arabia also show robust growth with Talabat in the UAE increasing from 38k to 40.2k listings (a 5.7% growth), and Hungerstation in Saudi Arabia increasing from 38.8k to 41.2k DSFs (a 6.2% growth)
- In contrast, Glovo in Kazakhstan, as a newer market, shows a growth rate of 4.5%, reaching 4.5k DSFs in the first quarter of this year
Despite local culinary delights, the presence of Western cuisine in the FSA space in the Middle East is quite significant. We checked amongst the digital storefronts in the platforms, to what extent they are offering burgers or pizza. Here’s what we found:
- Across the five platforms that we checked, there is a presence of burger offerings that ranges between 13.0% to 32.0%
- When it comes to the availability of pizza locations, it can vary from 6.0% up to almost 20.0% in number of digital storefronts
These insights on platform presence and cuisines can help brands tailor their offerings to meet local demands and identify potential opportunities in the market.
The immense volume of data available today holds untapped potential for shaping effective strategies in the food delivery sector. With Dashmote’s analytics, brands can transform complex data sets into actionable insights that propel growth and innovation, particularly in the dynamic market of the Middle East.
Dashmote assists enterprises in overcoming obstacles in the digital market space. As the foremost provider of big data and AI analytics solutions in the F&B sector, we enable informed strategic choices. Reach out to our team at contact@dashmote.com to establish a robust online footprint.
If you find this article valuable, you may also be interested to check out more of our blog articles on franchises, such as An Analysis of Spain’s Food Delivery Landscape and Empowering Heineken NL’s Online Presence Through Data-Driven Strategies.
Follow us on LinkedIn @Dashmote to stay up-to-date with the latest food delivery data insights globally.
Spain's rich culinary diversity makes it an ideal landscape for the growing food delivery industry. As the country that brought the world paella, tapas, and sangria, Spain's cuisine is as varied as its geography. The data presents a global trend where food delivery services are becoming an integral part of daily life. From 2019 to 2022, the online food delivery market in Spain more than doubled its revenue, reaching over €5 billion, showcasing an insatiable appetite for dining at the digital table [1]. With a remarkable surge in revenue in 2023 to €6.6 billion, the online meal and grocery delivery industry's financial trajectory highlights growing demand and a hungry consumer base eager for the convenience of food delivery [2]. This analysis taps into Dashmote's extensive data to provide insights on the dynamics of Food Service Aggregators (FSAs) and the potential that lies within Spain's food delivery sector.
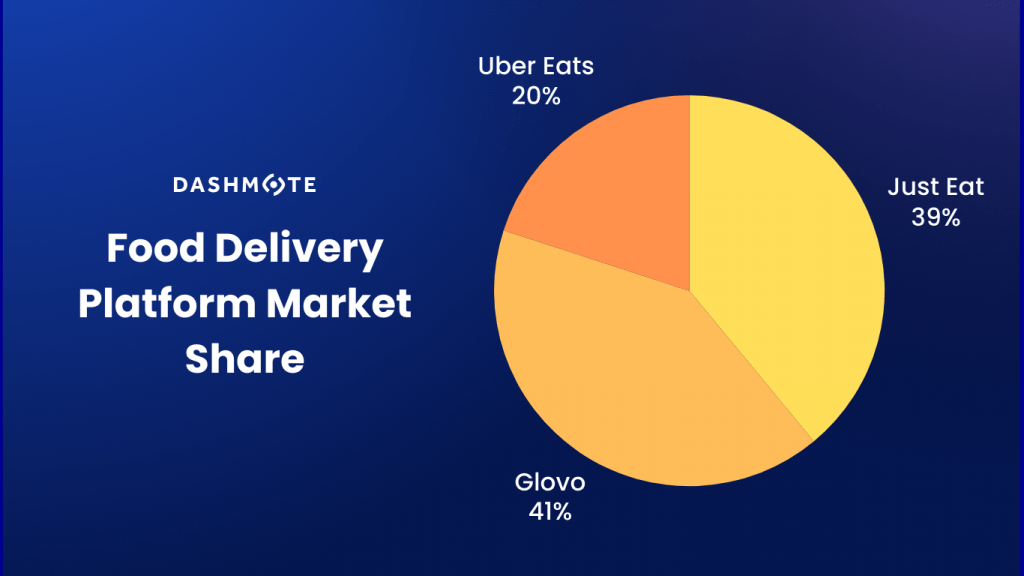
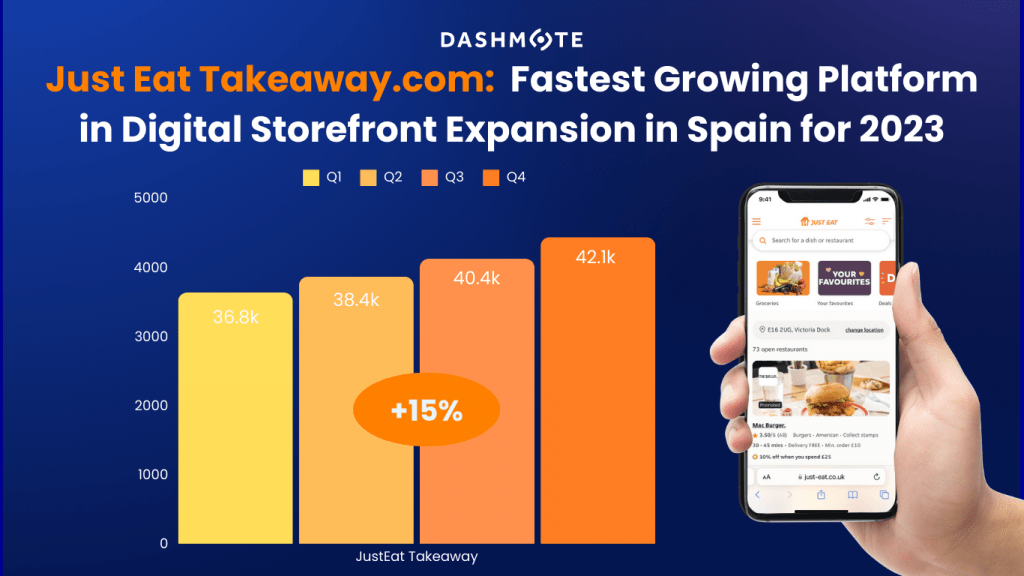
The Spanish food delivery market has experienced remarkable growth, now featuring over 108.6k DSFs (digital storefronts) across the country. We noticed intense competition primarily among the three major platforms we gathered insights from: Glovo, JustEat Takeaway.com, and Uber Eats. Glovo leads with a 41% market share, underscoring its extensive reach. JustEat Takeaway.com is a close second with 39%, while Uber Eats holds the third position with a 20% share.
Just Eat Takeaway.com is the fastest growing platform, with over 42.1k digital storefronts (DSFs) and experiencing a significant growth rate in comparison to its competition, 15% growth from Q1 to Q4 of 2023. With its rapid expansion, Just Eat Takeaway.com is gaining ground on Glovo, the current go-to choice for food delivery in Spain.
Madrid stands out as the core of Spain's food delivery operations, commanding 17% of the nation's digital storefronts. This concentration highlights the city's importance to the national market, as well as the potential it has for expansion.
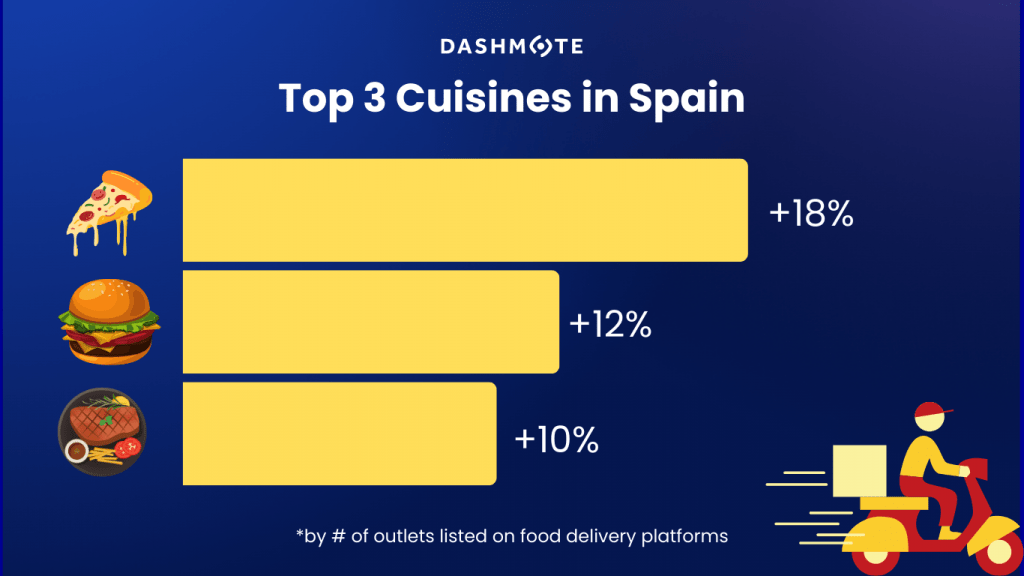
An analysis of cuisine types reveals a diverse palate among Spanish consumers, with pizza (18%), burgers (12%), and American cuisine (10%) topping the list of favorites. Dashmote’s analysis of online food imagery and menu offerings across platforms enables businesses to strategically expand their market presence, equipped with accurate, real-time data on popular cuisines, emerging food trends, and market opportunities.
Spain's food delivery market is constantly changing and growing. Gaining an understanding of market trends is important to gain strategic advantage, especially for new entrants or brands trying to broaden their offerings and increase their market share. Dashmote offers the insights necessary to effectively navigate this competitive landscape.
Dashmote assists enterprises in overcoming obstacles in the digital market space. As the foremost provider of big data and AI analytics solutions in the F&B sector, we enable informed strategic choices. Reach out to our team at contact@dashmote.com to establish a robust online footprint.
If you find this article valuable, you may also be interested to check out more of our blog articles on franchises, such as Empowering Heineken NL’s Online Presence Through Data-Driven Strategies and Diageo’s Digital Presence and Growth in the UK.
Follow us on LinkedIn @Dashmote to stay up-to-date with the latest food delivery data insights globally.
Introduced in 1967 by McDonald’s franchise owner Jim Delligati, the Big Mac can be purchased today in over 100 countries. While the ingredients remain the same worldwide, the cost of a burger varies depending on which part of the world you are in, as evidenced by the Big Mac Index. The Big Mac Index [1] not only highlights the economic disparities between nations, but also serves as a tangible measure of purchasing power and cost of living across the globe, making it an essential tool for economic analysis and insight.
In a previous article, we showcased price comparisons of Big Macs in 2022 [link], and now it is time for us to circle back to our annual tradition and bring you the latest insights from the Big Mac Index over the past year.
At Dashmote, we aim to harness technology to bring you a comprehensive view of the food delivery landscape worldwide. This index is about more than comparing prices; it's about uncovering valuable economic insights and inflationary trends.
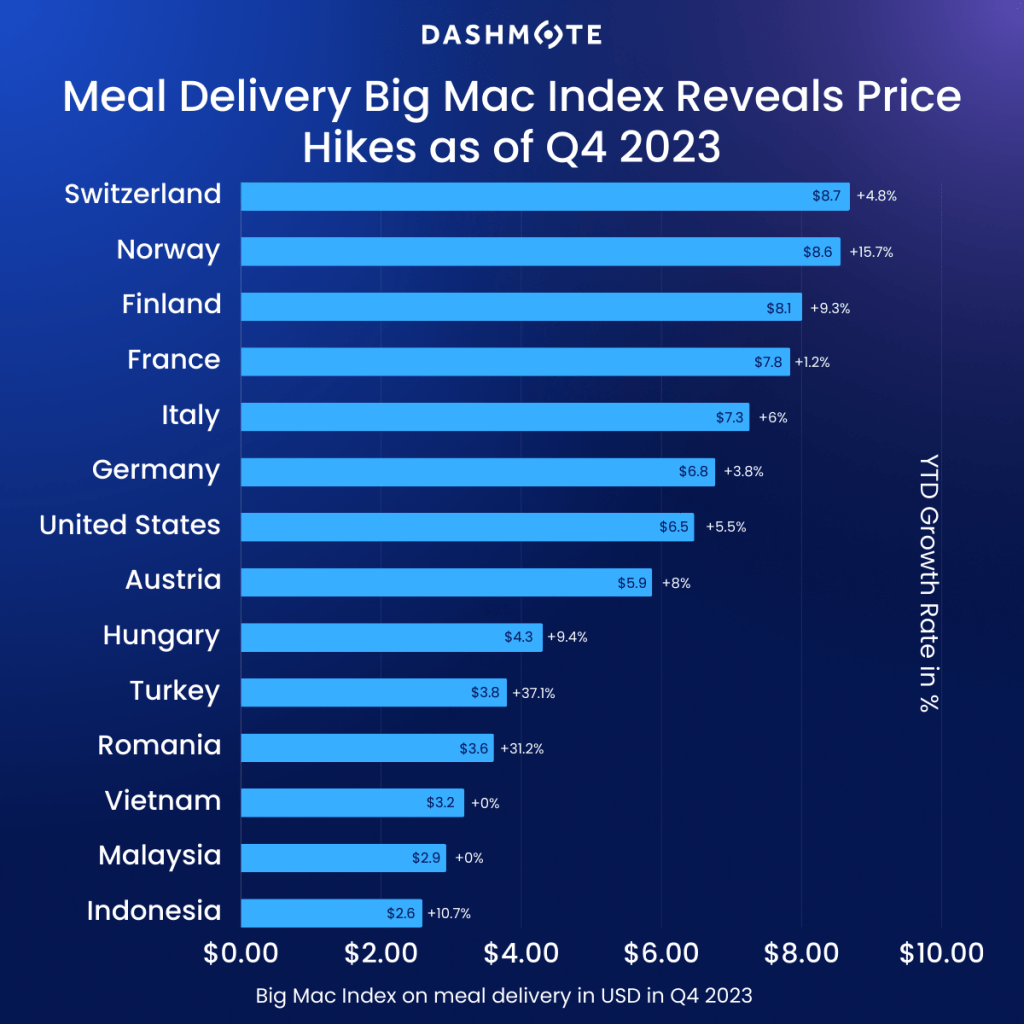
*prices were normalized to USD for better comparison
- From the 29 countries we did the analysis on, we note that average Big Mac prices on Food Delivery can vary from $2 up to almost $9.
- Switzerland ($8.7), Norway ($8. 6) and Finland ($8.1) are the countries with the highest Big Mac prices.
- Indonesia ($2.6), Malaysia ($2.9) and Vietnam ($3.2) turned out to be the countries with the lowest prices out of all the ones we analyzed.
- Over the course of 2023, countries with the highest inflation rates are Turkey (+37.1%), Romania (+31.2%) and Norway (+15.7%).
- The lowest inflation rates come from France (+1.2%) and Germany (+3.8%).
- Interestingly, Malaysia and Vietnam Big Mac prices were the same, with 0% inflation rates.
Dashmote is your ally in navigating the complexities of the digital marketplace, offering cutting-edge big data and AI analytics solutions tailored to the food and beverage (F&B) sector. Our comprehensive analysis and actionable insights empower businesses to make informed decisions and drive strategic growth in the food delivery industry. Ready to elevate your online presence and unlock new opportunities for your F&B enterprise? Get in touch with our team at contact@dashmote.com. Let's collaborate to establish a strong online presence for your business in the competitive F&B landscape.
If you found this article valuable, don't miss out on our other insightful blog posts covering topics like The Food Delivery Big Mac Index 2022 or Big Mac Around the World: A Journey Into Economics, all available on our blog.
Stay connected with us on LinkedIn @Dashmote for the latest updates and global food delivery data insights.
As the St. Patrick's Day celebrations came to an end, our attention turned to Ireland's food delivery scene. Delving into Dashmote's insights on Food Service Aggregators (FSAs) in Ireland, we wanted to explore how traditional Irish culture blends with contemporary delivery trends, shedding light on the opportunities and trends in the culinary landscape.
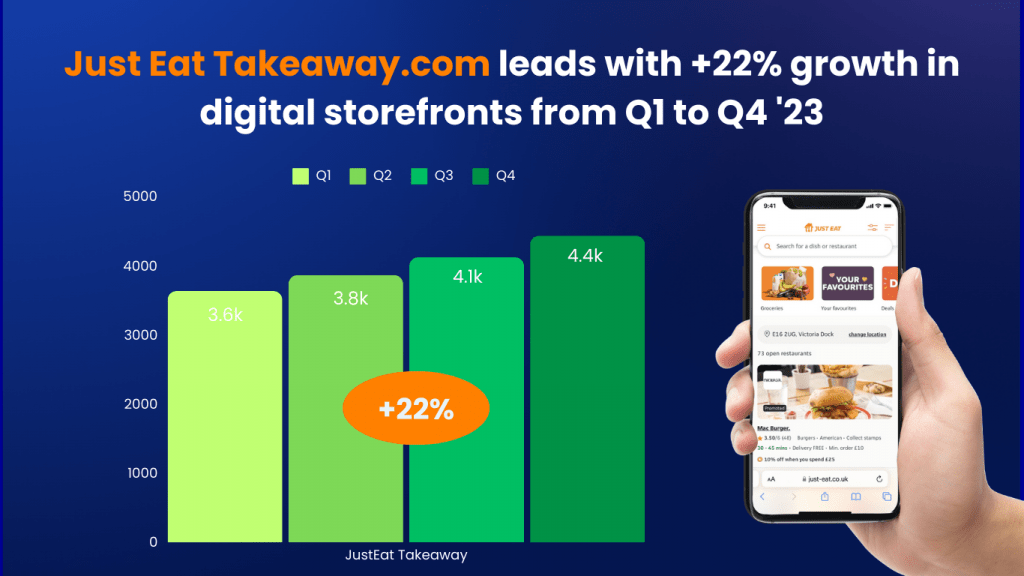
We gathered insights from 3 major players in the industry: JustEat Takeaway.com, Deliveroo and Uber Eats.
Ireland's food delivery landscape experienced a significant surge, with over 8,000 digital storefronts (DSFs) spread across the country witnessing an impressive 18% growth from Q1 to Q4 2023.
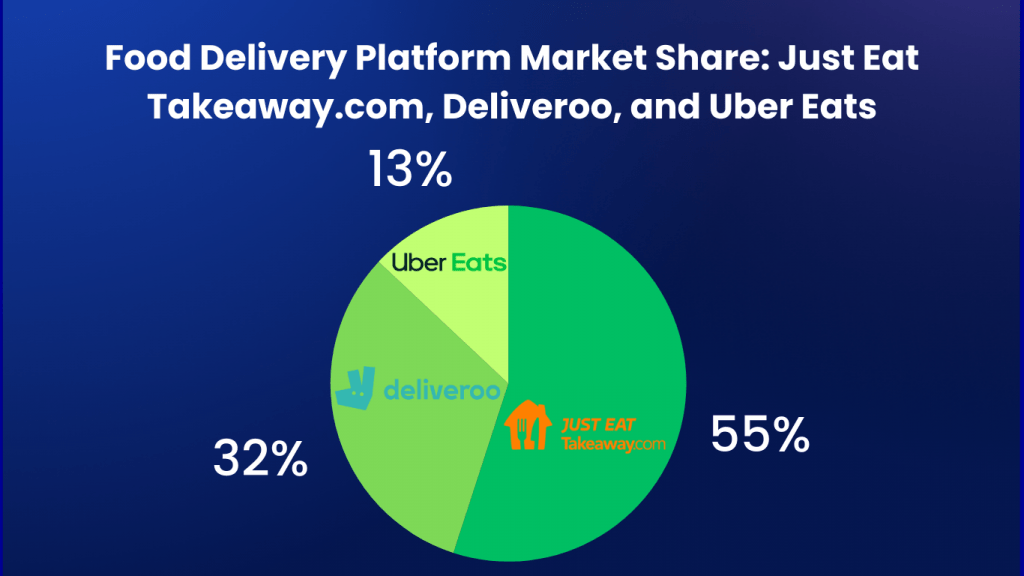
Just Eat Takeaway.com places first in the top, with a 55% market share in terms of digital storefronts within the Irish food delivery landscape, followed by Deliveroo at 32% and Uber Eats at 13%. These platforms, alike to mythical leprechauns, dominated the scene, offering a pot of gold for both consumers and businesses seeking convenient culinary experiences.
Just Eat Takeaway.com stood out as the largest and fastest growing platform, with over 4,000 digital storefronts (DSFs) and experiencing a significant growth rate in comparison to its competition, 22% growth from Q1 to Q4. With its rapid expansion, Just Eat Takeaway.com solidified its position as the go-to choice for food delivery, providing a seamless experience for both customers and restaurant partners [1].
For those who continued the celebrations at home, food delivery platforms offered plenty of options. Our analysis of the distribution of cuisine types revealed the percentage of DSFs representing each cuisine out of the total number of DSFs, and the top five preferred Irish cuisines. These include pizza (28%), burgers (24%), American fare (16%), chicken dishes (14%), and kebabs (10%). Similar to pub grub classics, these alternatives provide consumers with a flavorful feast fit for any St. Patrick's Day gathering.
As Ireland’s capital and biggest city, Dublin is the center of the country's food delivery scene, hosting 45% of its DSFs of the entire country. Dublin’s bustling streets in front of Temple Bar on St. Patrick's Day were filled with, you guessed it, beer! Guinness is the most popular choice for revelers on St. Patrick's Day, flowing freely in the heart of the city's vibrant pubs and eateries.
No St. Patrick's Day celebration would have been complete without a pint of Guinness, Ireland's beloved stout and cultural icon. With its rich brewing heritage and iconic toucan mascot, Guinness embodied the spirit of St. Patrick's Day, symbolizing Ireland's enduring influence on global beer culture. As celebrations unfolded, Guinness introduced its 'paint the town blue' campaign, offering free pints of Guinness 0.0 - a non-alcoholic version of the iconic stout - in over 800 Irish pubs until Monday, March 18. Embracing the blue color, the campaign encouraged patrons to savor the smooth taste of Guinness 0.0 and commemorate the holiday in style. Alan McAleenan, Guinness's marketing head in Ireland, expressed enthusiasm for championing Guinness 0.0 and moderation on St. Patrick's Day, fostering cultural appreciation. Partnering with Saoirse-Monica Jackson amplified this message, encouraging responsible consumption during the festivities. [2]
Fun Fact: When it comes to Guinness listings on FSA, the range is quite interesting. The least expensive Guiness is priced at 2.3€, while the most expensive one goes up to 6.0€, reflecting the diverse offerings available to Guinness lovers.
Dashmote assists enterprises in overcoming obstacles in the digital market space. As the foremost provider of big data and AI analytics solutions in the F&B sector, we enable informed strategic choices. Reach out to our team at contact@dashmote.com to establish a robust online footprint.
If you find this article valuable, you may also be interested to check out more of our blog articles on franchises, such as Empowering Heineken NL’s Online Presence Through Data-Driven Strategies and Diageo’s Digital Presence and Growth in the UK.
Follow us on LinkedIn @Dashmote to stay up-to-date with the latest food delivery data insights globally.
The aroma of competition is brewing in the coffee industry as CosMc's, a new concept by McDonald's, takes its first steps into the market. With the inaugural CosMc's location already gracing Bolingbrook, Illinois, and plans for expansion in the thriving metro areas of Dallas-Fort Worth and San Antonio, Texas, the coffee landscape might be about to witness a significant transformation.
According to insights from William Blair analyst Sharon Zackfia, CosMc's is deemed unlikely to pose a substantial threat to Starbucks' established dominance [1]. However, understanding the nuances of each player's strategy is crucial for brands looking to expand their online presence and brand dominance.
Motivated by our curiosity, we embarked on a thorough investigation into the dynamic competition between CosMc's and the coffee giant, Starbucks. Our focus centered on understanding Starbucks' current presence across the US, aiming to gain insights into the magnitude of the challenge that CosMc's faces as it strives to ascend to the heights set by the established coffee powerhouse.
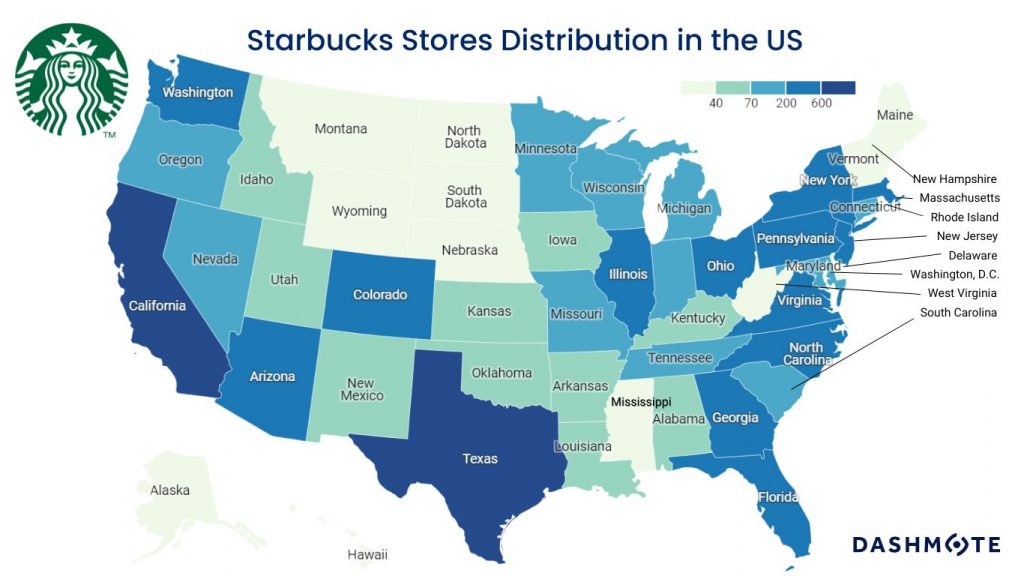
Our exploration takes us deep into Starbucks' distribution strategies, providing a comprehensive view into its physical and digital presence. We conducted research on Starbucks shops based on their food delivery presence as well as their geographical location at the end of 2023, in order to make a comparison between their physical and digital presence. The data unravels intriguing patterns in Starbucks' footprint across the United States.
- Diverse Market Saturation: The FSA dataset uncovers significant variations in the number of Starbucks outlets across different states. While California boasts a substantial presence with over 1300 outlets, Wyoming and Vermont have less than 10 stores each, signaling diverse market saturation and untapped growth opportunities.
- Top Performing States: Starbucks excels in California, Texas, and Florida, strategically saturating these populous and diverse states, particularly in urban areas. This widespread presence ensures accessibility and visibility, catering effectively to the diverse demographics of these states and building a broad customer base. The success is fueled by culturally resonant marketing strategies, turning Starbucks into more than just a coffee chain—it’s a cultural fixture [2]. This integration enhances brand loyalty and fosters a sense of community. These states provide valuable insights for expansion strategies. Analyzing urban and rural distribution unveils Starbucks' market strategy. Dashmote's geolocalization data, including contact information, offers a comprehensive view, aiding companies in tailoring strategies for suburban or rural markets.
- Market Penetration in the East: Starbucks has effectively established itself in eastern states like New York, Massachusetts, and Pennsylvania, capitalizing on urban and cultural centers. In New York, Starbucks has strategically located stores in bustling areas, catering to diverse demographics. The company's expansion in Massachusetts includes key locations in Boston and other urban hubs, targeting both residents and tourists. Additionally, Starbucks has successfully penetrated the market in Pennsylvania, where its coffee houses serve as popular meeting places.
- Potential Growth Areas: States with fewer Starbucks outlets, such as Montana, North Dakota, and Wyoming, are correlated with lower population densities. However the limited availability of Starbucks (digital) stores suggests untapped potential. Starbucks strategically allocates its resources based on market demand, population concentration, and economic factors. A thorough understanding of the unique dynamics in these regions, including demographics, competition, and cultural preferences, would provide insights into Starbucks' expansion decisions in these states, ensuring successful penetration.
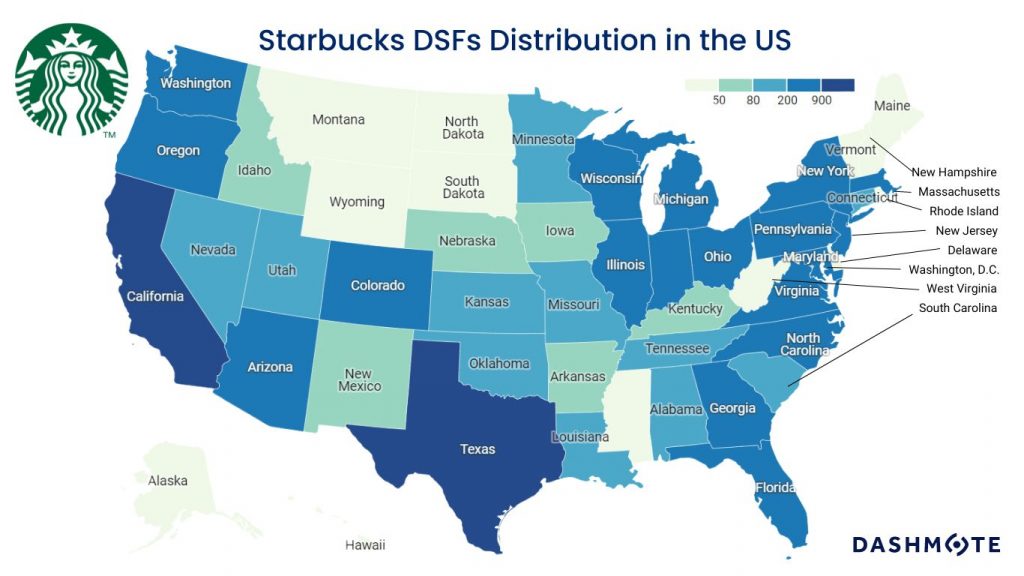
Starbucks' digital frontier is equally compelling, with a significant number of digital storefronts (DSFs) across states. California leads with almost 1,800 DSFs, followed by Texas (nearly 900) and Illinois (about 500). The higher number of DSFs compared to physical stores is attributed to the fact that a single store can leverage multiple food delivery platforms, showcasing Starbucks' substantial adoption of digital channels. For this data, we focused on the biggest players in food delivery in the US, Doordash, Uber Eats and Grubhub. Regional disparities in DSFs present opportunities for Starbucks to enhance its digital reach.
- Correlation with Physical Stores: Variations in digital and physical presence highlight strategic opportunities. Some states with a high number of physical stores also exhibit a robust digital presence, while others show disparities, suggesting room for improvement.
- Population Density Impact: In assessing the correlation between digital and physical presence, certain states, such as California, Texas, and New York, demonstrate a synergy where a substantial number of physical stores align with a robust digital presence. Conversely, states like Kansas and Oklahoma stand out for their significantly higher digital presence compared to the number of physical stores. Additionally, a noteworthy observation is that states with higher digital presence often coincide with densely populated regions, highlighting the convenience and accessibility facilitated by food delivery platforms.
- Market Adaptation and Consumer Behavior: Balancing physical and digital presence provides insights into Starbucks' adaptation to evolving consumer behaviors. States where digital presence surpasses physical stores signal a shift in consumer preferences toward online ordering.
- Digital Competitive Landscape: Comparing Starbucks' digital presence with competitors on food delivery platforms unveils the competitive landscape in the digital space, aiding in refining digital marketing and delivery strategies.
As the digital realm becomes integral to a brand's identity, the importance of a store's virtual presence is underscored. In today's landscape, relying solely on physical stores or a single food delivery platform may limit reach and accessibility. A multi-platform digital strategy enables a store, whether a large chain or a smaller establishment, to cater to diverse consumer preferences and leverage the growing trend of online ordering and food delivery, ensuring a broader and more resilient market presence
Dashmote assists enterprises in overcoming obstacles in the digital market space. As the foremost provider of big data and AI analytics solutions in the F&B sector, we enable informed strategic choices. Reach out to our team at contact@dashmote.com to establish a robust online footprint.
If you find this article valuable, you may also be interested to check out more of our blog articles on franchises, such as The World of McFlurry and Beverage Menus on European Franchises.
Follow us on LinkedIn @Dashmote to stay up-to-date with the latest food delivery data insights globally.
The concept of preserving food in containers dates back centuries. Ancient civilizations used various methods such as smoking, drying, and fermenting to extend the shelf life of food. Later on, in 1810, the Englishman Peter Durand patented the idea of preserving food in tinplate cans. This marked the beginning of the canning industry.
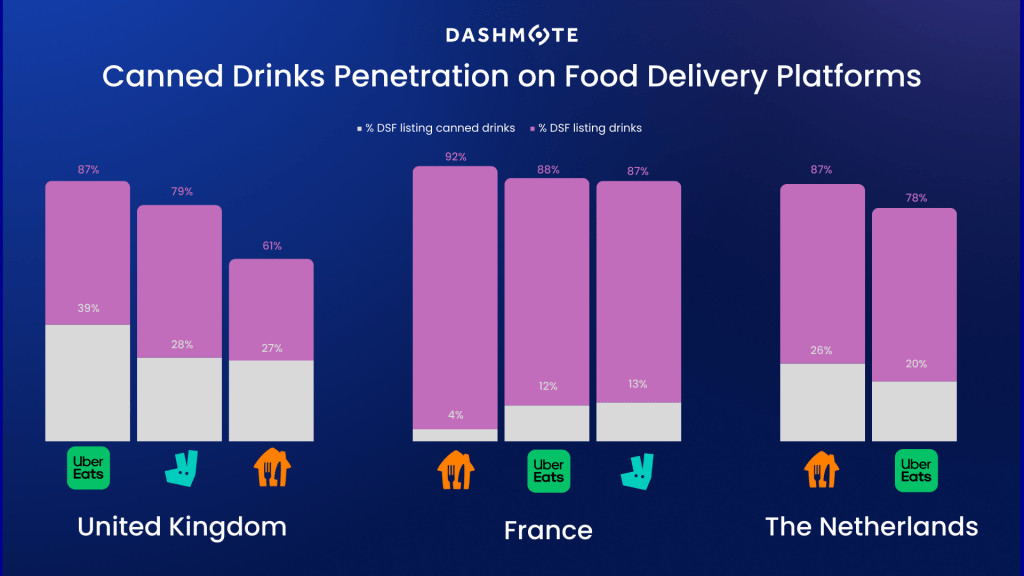
We conducted comprehensive research across the dynamic landscapes of the Netherlands, the United Kingdom, and France, focusing on the leading platforms JustEat Takeaway.com, Uber Eats, and Deliveroo. While focusing on canned drinks is crucial, understanding the total landscape of DSFs listing drinks provides a comprehensive view.
Analyzing the year-end landscape, Uber Eats takes the lead in the UK with 39% of DSFs listing canned drinks, closely followed by Deliveroo with 28% and JustEat Takeaway.com with almost 27% of DSFs listing canned drinks. In the UK, Uber Eats has the highest number of DSFs listing drinks (86%), showcasing the popularity of beverages on food delivery. Given the existing high popularity of drinks on UK food delivery platforms, suppliers should explore opportunities beyond canned drinks to further cater to their consumers.
Deliveroo dominates with a substantial 13% of DSFs, prominently featuring canned drinks in the French food delivery landscape. Parallelly, Uber Eats secures a notable 12% of DSFs, while JustEat Takeaway.com commands nearly 4%. Noteworthy is JustEat Takeaway.com's overall leadership, boasting an impressive 92% of DSFs featuring drinks, demonstrating a nuanced approach with only 4% dedicated to canned options. This gap in the market suggests a potential area for suppliers to capitalize on and explore within the extensive drinks category.
Delving into the dynamics of the Netherlands' year-end food delivery landscape, JustEat Takeaway.com emerges as a formidable leader, commanding an impressive 26% of DSFs, while Uber Eats secures a noteworthy 20% share. It’s worth mentioning that Deliveroo exited the Netherlands in November 2022, hence the platform doesn’t form part of this analysis. Between Uber Eats and JustEat Takeaway.com, the latter has the highest number of DSFs listing drinks (87%). Given the intense competition between these two platforms, strategically emphasizing the beverage listings could offer both suppliers and food delivery platforms a valuable edge in meeting the diverse preferences of consumers.
- It is worth noting that in France and the Netherlands, JustEat Takeaway.com has a stronger presence than in the UK, which reflects on the variations between different markets and platform sizes, and the need to have reliable data to base decisions on.
- Drink penetration is a lot higher in France and the Netherlands compared to the UK, although there are differences per platform. In the UK, across all 3 platforms, the average drink penetration is almost 78%, whereas in France and the Netherlands, this number rises to a staggering 89% and 83% respectively.
- Can penetration is notably higher in the UK than in France, especially on JustEat Takeaway.com, where only 4% of DSFs are selling canned drinks.
To navigate the intricate landscape of the food delivery industry successfully, it's important for canned drink suppliers to prioritize packaging clarity. Clear and standardized information on packaging not only boosts consumer confidence but also enhances the appeal of canned beverages. In the fiercely competitive market, aligning with platform preferences in each country becomes crucial, requiring suppliers to emphasize unique selling points and communicate transparent packaging information effectively. Collaborative marketing endeavors, whether through partnerships with leading food delivery platforms or direct engagement with merchants, have the potential to elevate visibility and attract a larger customer base. Furthermore, in this data-driven era, suppliers can revolutionize their growth strategies by leveraging Dashmote's expertise. Dashmote’s data unlocks visibility on the FSA landscape, providing actionable insights which can help teams make more informed decisions.
Dashmote assists enterprises in overcoming obstacles in the digital market space. As the foremost provider of big data and AI analytics solutions in the F&B sector, we enable informed strategic choices. Reach out to our team at contact@dashmote.com to establish a robust online footprint.
If you find this article valuable, you may also be interested to check out more of our blog articles on beverages, such as Dr Pepper Franchises and Beverage Menus on European Franchises.
Follow us on LinkedIn @Dashmote to stay up-to-date with the latest food delivery data insights globally.
Diageo, a British multinational alcoholic beverage company established in 1997, stands as one of the world’s leading premium drinks businesses. Based in North-West London, UK, the company originated from the merger of Guinness and Grand Metropolitan. Operating in over 180 countries and boasting a portfolio of 200 brands, Diageo is a dominant force in the global beverage alcohol industry, excelling in both spirits and beer. Its prominent brands encompass Johnnie Walker, Smirnoff, Tanqueray, Baileys, Guinness, and numerous others, commanding a substantial 25% of the global volume share [1].
In 2022, the company accrued approximately 15.452 billion British pounds in net sales [2]. Among its diverse product range, scotch whisky constituted the most significant portion of Diageo's portfolio in terms of net sales. Beer and vodka held the second and third positions, respectively [3].
Utilizing technology adeptly to expand its reach and establish efficient connections with consumers, Diageo has forged partnerships with several food delivery platforms like UberEats and Deliveroo. By leveraging Dashmote’s Data Analytics SaaS platform, a comprehensive analysis of the 5 primary brands of Diageo on food delivery platforms in the UK was conducted. This analysis aimed to obtain valuable insights into their penetration rates, growth patterns, and overall market performance.
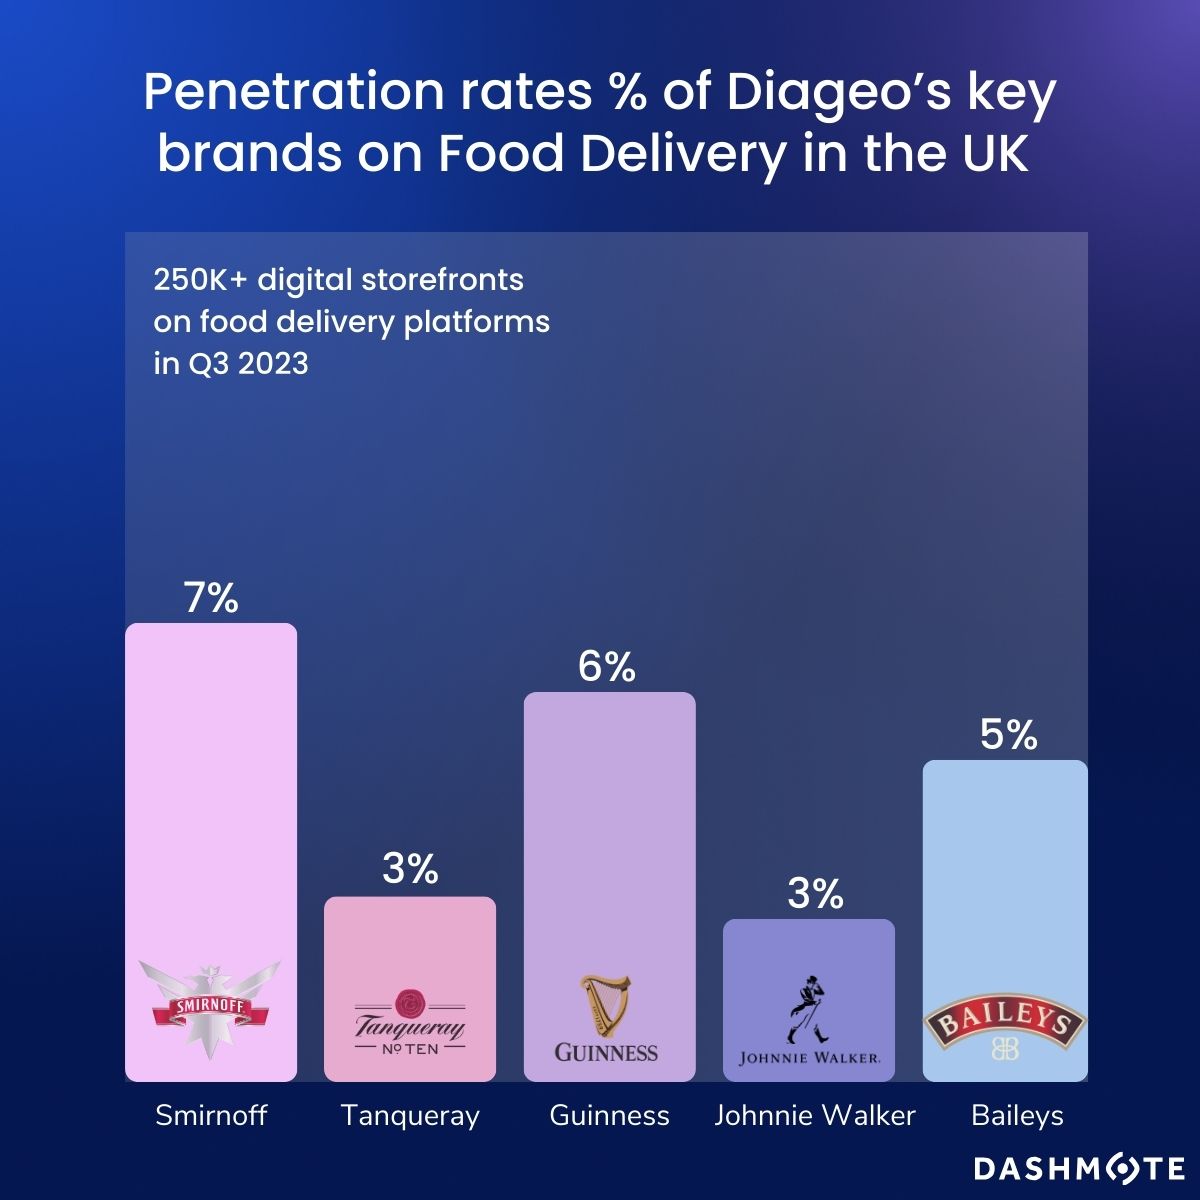
Dashmote’s data shows that in Q3 2023, there were over 252K digital storefronts operating on British food delivery platforms. Smirnoff emerged as the dominant player in the British delivery landscape, boasting an impressive 18K digital storefronts offering its products. This remarkable presence resulted in a substantial penetration rate of 7%, which stands as the highest among all Diageo’s brands in the current study. Johnnie Walker and Smirnoff are two of the world’s four largest international spirits brands by retail sales value [4]. In Diageo’s 2022 annual report, they noted Smirnoff’s net sales grew double digits in all regions, with a particularly strong performance in Europe [5]. Our food delivery data reflects this dynamic market domination.
As shown in the above graph, all 5 brands exhibit notable digital storefront listings surpassing 3% in Q3 2023. Its iconic global brand Guinness takes the second place, with 6% of all DSFs offering food delivery featuring its products. This is followed by Bailey’s at 5% and Tanqueray at 3%.
Our data reveals that while various Diageo brands are present in the British food delivery sector, a considerable portion of the market remains untapped. For instance, Guinness exhibits a smaller penetration rate in comparison to Heineken, a Dutch beer brand, which holds a 7% penetration rate. The contrast becomes more pronounced when considering the dominance of the nr 1 soft drink company, which boasts a penetration rate of 72% across British food delivery platforms. Although it's important to note that alcoholic beverages encounter more restrictions in the food delivery market compared to soft drinks, by effectively leveraging food delivery data, there still exists a significant headroom for sustainable, long-term growth for Diageo in the food delivery industry.
Over the past decade, total beverage alcohol (TBA) has consistently shown robust value growth, with international spirits, where Diageo is the number one player, expanding at a faster rate compared to TBA [6]. While Diageo reported a 18% increase in operating profit in 2022, Dashmote data revealed the substantial growth in digital presence among its 5 key brands on British food delivery platforms.
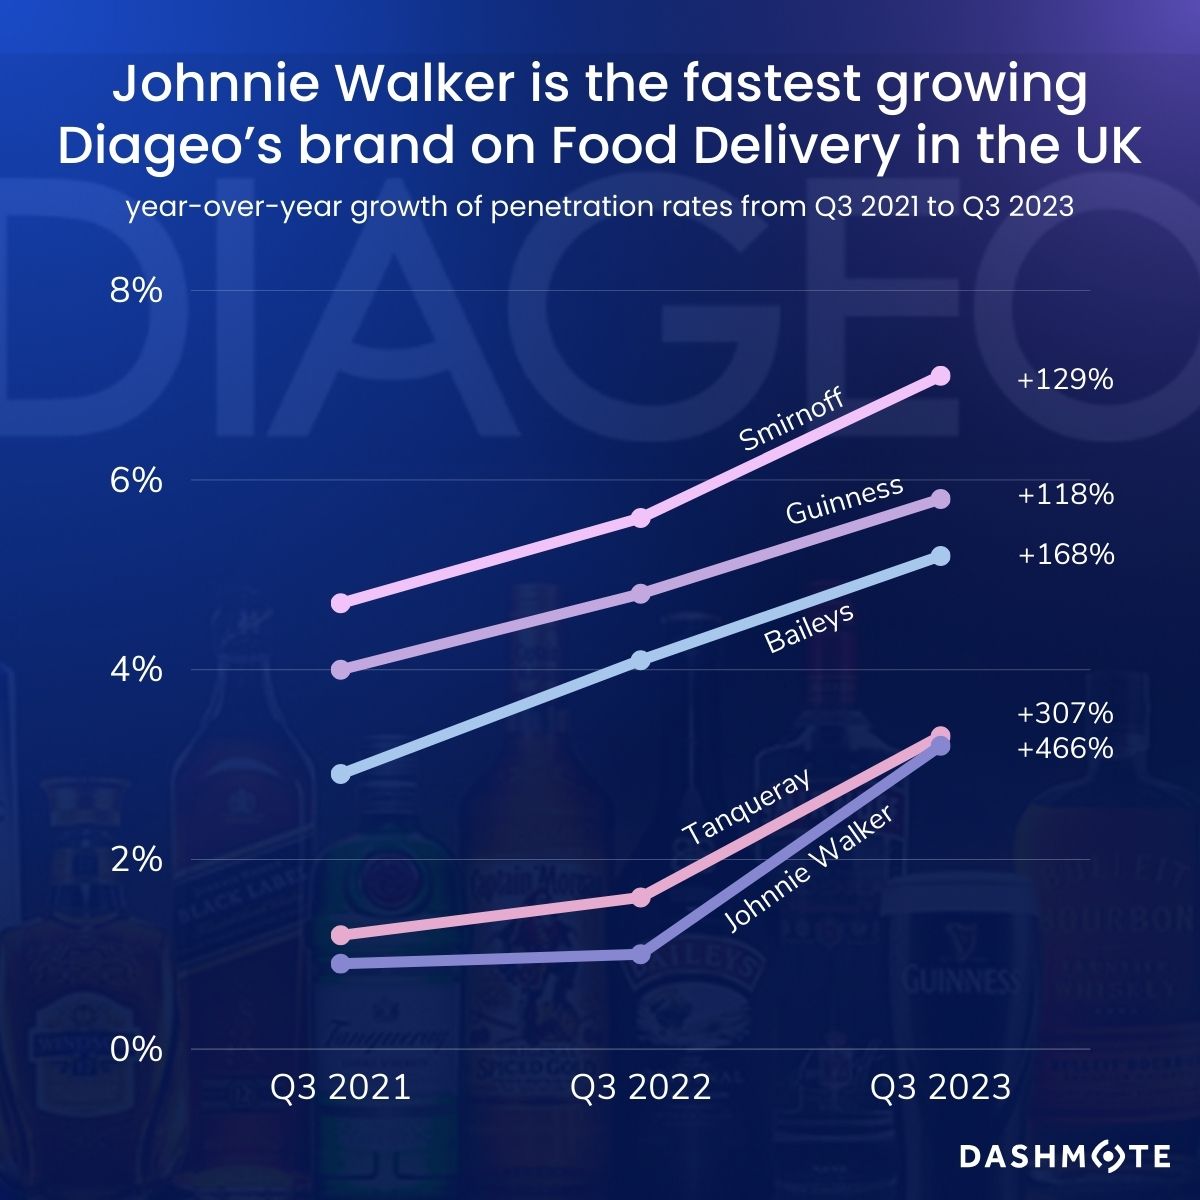
In recent years, the food delivery sector in the UK has experienced an unprecedented surge - the total digital storefronts exhibited a remarkable growth of 51% since Q3 2021. Along with the growing market, Johnnie Walker has achieved the most substantial growth of 466% in its digital storefront listings in the past 2 years. Following closely behind is Tanqueray, registering impressive growth rates of 306%. Bailey’s (+168%), Smirnoff (+129%), and Guinness (+118%) all have doubled their digital presence since Q3 2021. Dashmote’s data demonstrates the strong performance of Diageo in the British food delivery sector. By leveraging food delivery data, Diageo would continue to shape their brand portfolio, ensuring continual and sustainable growth.
Dashmote is dedicated to assisting enterprises in overcoming obstacles and achieving success in the digital market space. As the foremost provider of big data and AI analytics solutions in the food and beverage (F&B) sector, we enable companies to make informed strategic choices by offering thorough analysis and invaluable insights into the food delivery market and F&B trends. Interested in taking your online business to the next level? Feel free to reach out to our team at contact@dashmote.com. Together, we can establish a robust online footprint for your Food & Beverage enterprise.
If you find this article valuable, you may also be interested to check out more of our blog articles on beers, such as Heineken or Carlsberg.
Follow us on LinkedIn @Dashmote to stay up-to-date with the latest food delivery data insights on a global scale.
The food delivery sector is revolutionising the food and beverage (F&B) industry, even impacting renowned brewers like Heineken. Founded in 1864, Heineken, a Dutch beer company, originated when a 22-year-old named Gerard Adriaan Heineken acquired a brewery in Amsterdam. Presently, it stands as one of the globe's most prominent and easily recognizable beer brands, with its products distributed in more than 170 countries. As a leading brewing group with the second largest production volume worldwide [1], it is bolstering its performance and experiencing increased popularity from leveraging the food delivery platforms.
The beer market in Southeast Asia amounts to US$23.63bn in 2023. The market is expected to grow annually by 6.74% (CAGR 2023-2027) [2]. The area exhibits a growing inclination among consumers for alcoholic drinks, alongside a rising desire for low-alcohol and non-alcoholic beers. Heineken's strategic move into the food delivery sector with its original and non-alcoholic products aligns with these trends, showcasing their forward-looking strategy to remain relevant and easily reachable in the swiftly changing environment.
In this article, we conduct a Heineken Southeast Asian case study. By leveraging Dashmote’s Data Analytics SaaS platform, we analysed Heineken’s presence and growth on food delivery platforms throughout 7 key markets.
Heineken can be found on various food delivery platforms in Southeast Asia, including Gojek, Grab, Lineman, and many more. The specific Heineken beer options available may vary depending on the restaurants and stores, but they typically include Heineken Lager, Heineken 0.0 Non-Alcoholic, and Heineken Silver.
According to Dashmote's data, Heineken has a food delivery beer presence exceeding 30% in 3 out of 7 countries in the current analysis. Notably, Heineken holds a strong position on Vietnamese food delivery platforms, where 64.1% of digital storefronts which sell beers also feature Heineken products. The Philippines ranks second, with a 35.5% beer penetration rate, meaning that 1 in 3 beer-selling restaurants on food delivery platforms offers Heineken. Singapore follows closely with a penetration rate of 31.1%. It's worth mentioning that Heineken's presence in Indonesia (11.2%) and Thailand (8.1%) remains relatively low due to distinct drinking customs and alcohol consumption regulations in these regions.
Since the above analysis pertains to digital storefronts specifically selling beers rather than encompassing all digital storefronts on the platforms, it's essential to recognize that the beer market presence in Southeast Asia remains relatively limited on food delivery, ranging from 0.71% in Indonesia to 11.3% in Singapore. In contrast, when compared to Europe, where 9 countries have a Heineken presence exceeding 10% across all digital storefronts in the respective nation, Heineken still has room for gradual expansion to attain a more substantial foothold in the Southeast Asian market.
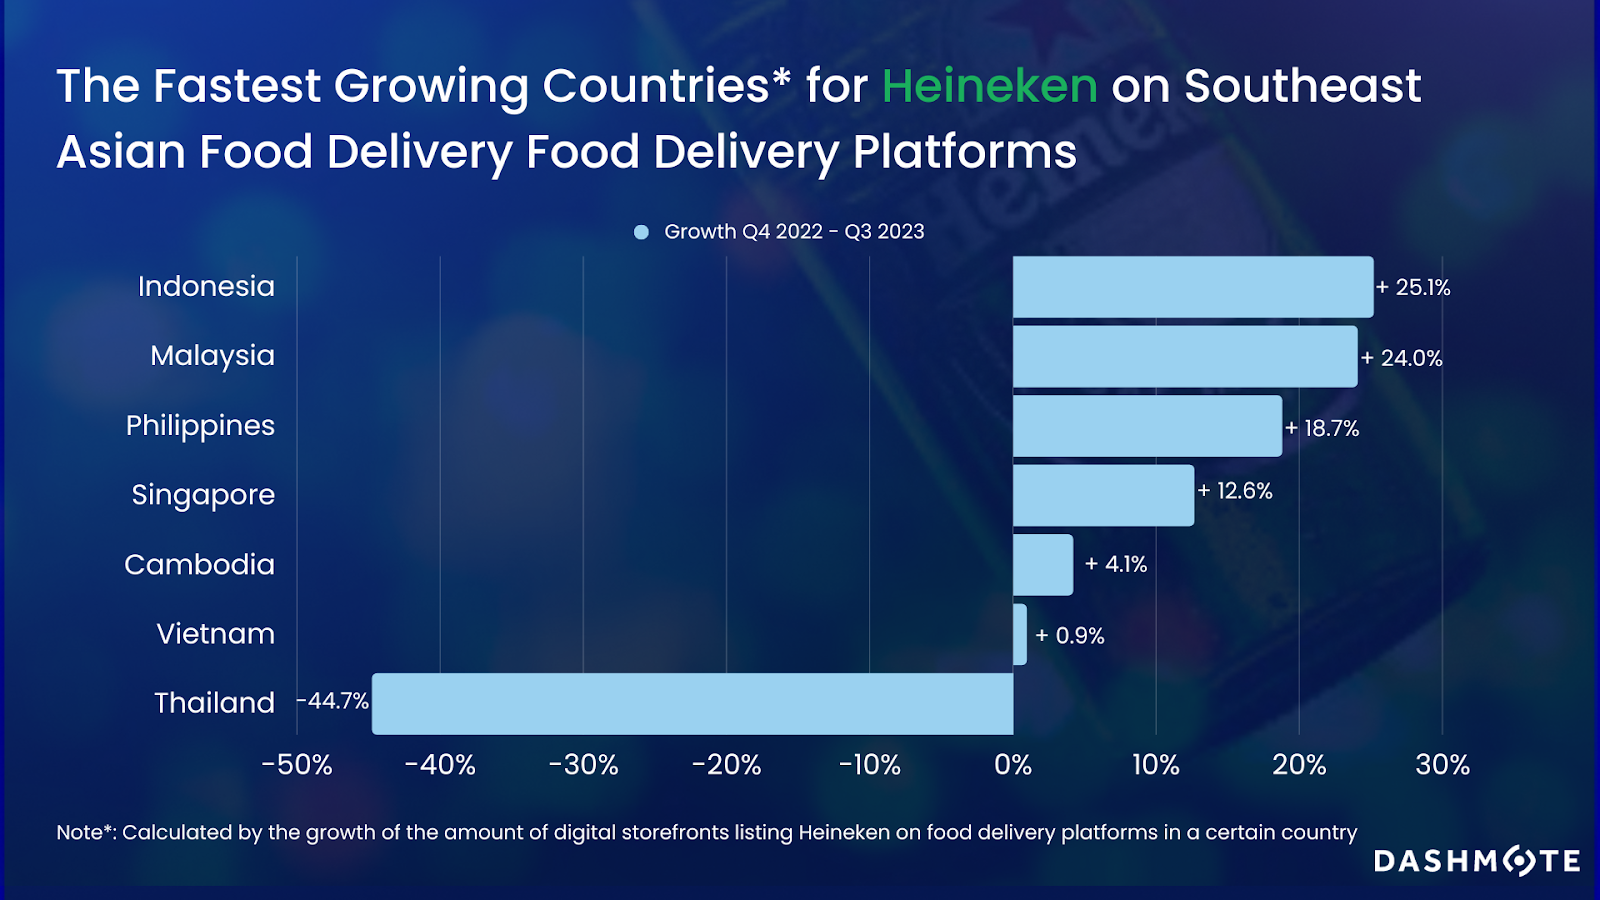
Based on Dashmote’s data, a majority of countries have witnessed a noteworthy growth in Heineken’s digital storefront listings on food delivery platforms spanning from Q4 2022 to Q3 2023. Indonesia experienced the largest increase of 25.1%. Following closely is Malaysia, exhibiting a remarkable growth of 24.0%, and Philippines with a commendable 18.7% expansion. Vietnam, although with the largest digital storefront base for Heineken, demonstrated the lowest positive growth of 0.9% over the past three quarters. Conversely, Thailand (-44.7%) encountered substantial declines in Heineken's digital storefront listings, which stands out as an intriguing exception among this trend of growth.
Upon scrutinising the data, it becomes apparent that the decline in the number of digital storefronts offering Heineken in Thailand is predominantly attributable to external factors rather than inherent issues with the brand itself. For example, the reduction of over 400 stores of Mini Big C, a convenience store in Thailand, on food delivery platforms during the timeframe under examination directly impacted the decrease in digital storefronts selling Heineken. This highlights that Heineken's performance in food delivery is significantly influenced by the broader market conditions and underlying macroeconomic variables.
In Southeast Asia, consumers who prioritise their health are actively looking for beer alternatives that offer reduced alcohol content or are entirely alcohol-free. The Non-Alcoholic Beer market in Southeast Asia is currently valued at US$1.91 billion in 2023, and it is projected to experience an annual growth rate of 8.84% (CAGR 2023-2027) [3]. In the midst of this expanding trend, Heineken 0.0 emerges as an ideal choice for those pursuing wellness and healthier living.
Dashmote's data reveals the promising early stages of Heineken 0.0's presence on Southeast Asian food delivery platforms. While it has already established itself in several countries, it has yet to make inroads into markets like Indonesia and Cambodia.
In Vietnam, Heineken 0.0 enjoys the most substantial digital presence, with 17.9% of digital storefronts selling beer offering this product. This achievement follows an impressive 60.1% digital growth from Q4 2022 to Q3 2023. Similarly, Singapore has seen a noteworthy increase of 79.7% in digital storefront listings for Heineken 0.0, resulting in a beer penetration rate of 7.2% in Q3 2023. In Malaysia, Heineken 0.0 also experienced a notable rise of 40.3% in digital storefront listings, even though its beer penetration rate remains relatively modest at 2.5%.
Dashmote is dedicated to assisting enterprises in overcoming obstacles and achieving success in the digital market. As the foremost provider of big data and AI analytics solutions in the food and beverage (F&B) sector, we enable brands to make informed strategic choices by offering thorough analysis and invaluable insights into the food delivery market and F&B trends. Interested in taking your online business to the next level? Please reach out to our team at contact@dashmote.com.
If you find this article valuable, you may wish to check out more of our blog articles on other beer brands, such as Carlsberg and Heineken in Europe.
The delivery market within the food industry has experienced an exponential amount of growth over the last couple of years. With a new Lumina Intelligence report (2022) acknowledging the use of delivery as ‘habitual to consumers’ [1]. This growth can be attributed to busy lifestyles, urbanization, digitalization, and the desire for a wide variety of culinary options. However, the food delivery space is also largely influenced by the operational challenges faced by restaurants, with approximately 60% of restaurants failing within their first year of operation, and 80% don't survive beyond five years [2]. These multifaceted factors collectively contribute to the food delivery market's status as a rapidly evolving and highly-uncertain industry.
Monitoring the newly opened and closed digital storefronts on the food delivery platforms holds significant importance for food and beverage brands. By maintaining a keen awareness within the industry, brands can identify newly established outlets, offering potential collaboration opportunities for the distribution of their products. Simultaneously, an monitoring the cessation of operations at certain digital storefronts, leading to the discontinuation of their product sales, is essential for tracking a brand's market performance.
Furthermore, it is crucial to acknowledge that restaurants do not readily alter their menu offerings, making it imperative to identify those new ventures amenable to forging fresh partnerships. Brands that fail to monitor and adapt to this changing landscape risk losing market share and relevance in the industry.
In this article, we undertake an analysis of the changes occurring in the food delivery sector in both the UK and Australia. Our examination focuses on the shifts in the digital storefront base within the dominant platforms in this industry. By leveraging Dashmote’s data, we found alarming trends of 2023 food delivery that can help your food and beverage brands to maintain their competitive edge in the market.
The UK is one of the biggest markets for food delivery, with Lumina Intelligence stating that 12% of UK adults order delivery at least once per week [3]. The projected revenue in the Online Food Delivery market in the UK is expected to experience an annual growth rate (CAGR 2023-2027) of 12.12% and reach US$40.64bn in 2023 [4]. The market is contestable although dominated by a small number of firms such as Just Eat, Uber Eats and Deliveroo. According to a global consumer survey conducted in the country in 2022, 69% of respondents used Just Eat within the past 12 months. Meanwhile, 48% of respondents used Deliveroo and Uber Eats [5].
According to Dashmote’s data, 3.9% of the digital storefronts in the UK closed during Q2. Specifically, Uber Eats saw 6.3% of its digital storefronts shutter in Q3 2023, while Deliveroo faced a 2.1% closure rate.
During the same period, it's noteworthy that the rate of newly opened digital storefronts exceeded that of closures, indicating a net growth in the food delivery market. In Q2, 5.2% of digital storefronts were opened alongside the 96.1% of existing ones, underscoring the expansion of the market. If you require precise information regarding the specific storefronts that have opened or closed, please do not hesitate to email us at contact@dashmote.com.
Revenue in the Australian food delivery market is expected to show an annual growth rate (CAGR 2023-2027) of 6.61%, resulting in a projected market volume of US$2.70bn by 2027[6]. With over 20 online food ordering and delivery platforms in Australia, the market remains a highly competitive space. Several well-known players such as Deliveroo and Foodora have already left the Australian market. Today, DoorDash, Menulog, and UberEats are considered as the most popular food delivery platforms in Australia [7].Dashmote’s data reveals that in Q2, 3.3% of digital storefronts on Uber Eats closed, with 95.6% still in operation. Notably, the rate of newly opened digital storefronts stands at 7.7%, which is more than twice the rate of closures. This data emphasizes the swift growth of the Australian food delivery market.
Dashmote is dedicated to assisting enterprises in overcoming obstacles and achieving success in the digital market space. As the foremost provider of big data and AI analytics solutions in the food and beverage (F&B) sector, we enable companies to make informed strategic choices by offering thorough analysis and invaluable insights into the food delivery market and F&B trends. Interested in taking your online business to the next level? Feel free to reach out to our team at contact@dashmote.com. Together, we can establish a robust online footprint for your Food & Beverage enterprise.
If you find this article valuable, you may also be interested to check out more of our blog articles on Uber Eats.
Follow us on LinkedIn @Dashmote to stay up-to-date with the latest food delivery data insights on a global scale.