In the vast expanse of the American beer market, a compelling trend is emerging for FSA providers, in the form of Dry January. This abstinence-centric month has traditionally posed challenges for beer sales, but this year unveils a silver lining. Dashmote's extensive dataset provides invaluable insights into the rise of FSAs in the United States, painting a picture of shifting consumer preferences and expanding opportunities.
Every year during Dry January, beer brands face a unique challenge, but a promising opportunity. In this exploration of the US beer market, we uncover a silver lining amidst the rise of Dry January, connecting the rise of non-alcoholic beer with the dynamic growth of US food delivery. Dashmote's robust dataset guides us through the changing tides of consumer preference, presenting beer brands with a compelling narrative and strategies for success.
Dry January's Impact on Beer Consumption
The phrase "Dry January" may send shivers down the spines of beer marketers, but this year brings a glimmer of hope. According to Statista [1], the volume share of low-alcohol and non-alcoholic beer in the US next year will be about 3.2% compared to 13% in Spain, the top consuming country. Jonnie Cahill, chief marketing officer at Heineken USA, said “That tells you there's an opportunity there, because if you take a long-term view, which we've done with his innovation, which is we're in it for five, 10, 20, 50, 100 years, it's gonna get there”. By utilizing Dashmote’s intuitive app and accessing data insights, alcohol-free beer brands will be able to breach the non-alcoholic beverage market.
The Rise of Low- and No-Alcohol Beer During Dry January
The Morning Consult study, commissioned by the Beer Institute, reveals a fascinating trend among Dry January participants. In the US, about 65 percent of people between the ages of 21 and 54 said they were “somewhat to very likely” to observe Dry January. Over half of Americans opting for a dry month are turning to low- and no-alcohol beer to help them achieve their goals. Brian Crawford, the president and CEO of the Beer Institute, notes that "as many Americans increase their focus on moderate consumption, a growing majority of them are using low- and no-alcohol beer to help them hit their goals. [2]
US Food Delivery Platforms Paving the Way for Alcohol-Free Brand Success
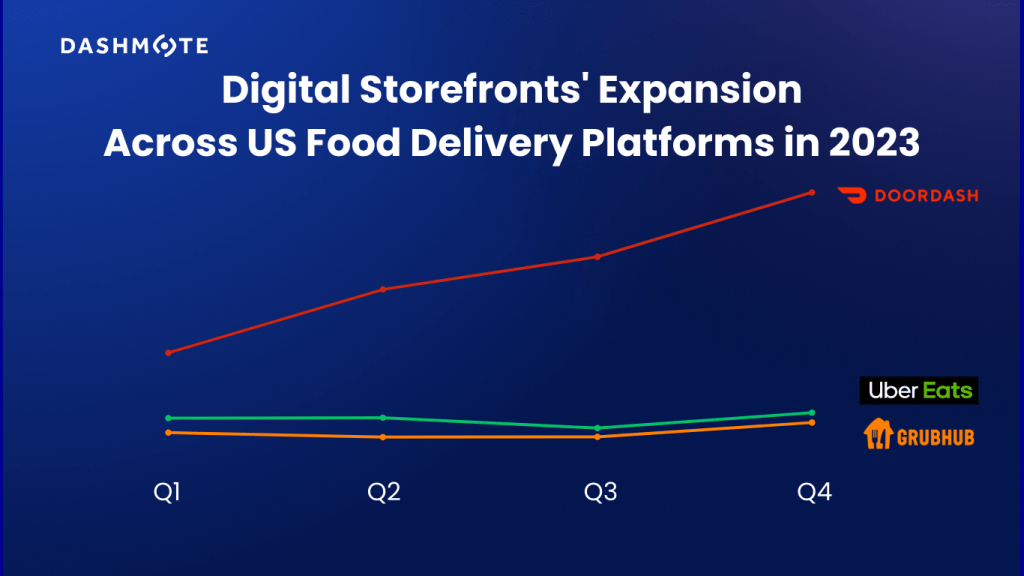
In the dynamic realm of US food delivery, the growth rates from Q3 to Q4 of 2023 present a captivating narrative for major platforms. We leveraged Dashmote’s data to check the number of DSFs present on each platform and compare them with growth rates quarter-over-quarter.
- Doordash Dominance: Doordash, a standout performer, exhibits impressive growth rates throughout 2023. In the first quarter, the FSA’s market share in the US were quite similar, standing at 400k to 460k DSFs each. The platform witnessed a substantial 9% increase from Q3 to Q4, capping off the year with an outstanding 26% surge.
- GrubHub's Resilience: Despite facing challenges earlier in the year, GrubHub demonstrates resilience in the latter part of 2023. The platform shows a commendable 2.7% growth from Q3 to Q4, showcasing its ability to adapt and maintain a steady market presence. This positive trajectory positions GrubHub as a reliable player in the evolving food delivery landscape.
- UberEats' Strategic Growth: UberEats strategically maneuvers the market dynamics, achieving a 2.8% growth from Q3 to Q4. This signifies the platform's responsiveness to evolving consumer demands and its consistent efforts to enhance its digital storefronts. UberEats concludes the year on a positive note, contributing to the overall growth in the US food delivery universe.
- Total FSA Universe Soars: Overall, between Q3 and Q4, there was a noticeable increase compared to the previous quarters for FSA (food service aggregators). Dashmote’s data unveils an impressive 10.3% growth in Q4.
Market Penetration Opportunity for Alcohol-Free Brands
The US food delivery expansion not only signifies the industry's adaptability but also presents a substantial opportunity for alcohol-free beer brands to establish a more robust presence in the market. As American consumers increasingly embrace low- and no-alcohol beer options, the US beer industry strategically positions itself to meet this growing demand. Dashmote's dataset serves as a reinforcing compass, illustrating the industry's commitment to accommodating changing consumer preferences and embracing sobriety, all while upholding the craft and quality that defines its character.
Conclusion: Riding the Wave of Non-Alcoholic Beer's Momentum
The data-driven insights unveil a promising landscape for non-alcoholic beer within the food delivery sector. Despite historical challenges during Dry January, expanding digital storefronts and overall growth in the food delivery universe highlight a positive trajectory for alcohol-free options. Breweries across the US, investing in non-alcoholic technology and processes, provide consumers with diverse choices. Dashmote's data navigates brewers through the tides of change, as the appeal of non-alcoholic beers becomes a prevailing force in the ever-evolving American beer market.
Dashmote assists enterprises in overcoming obstacles in the digital market space. As the foremost provider of big data and AI analytics solutions in the F&B sector, we enable informed strategic choices. Reach out to our team at contact@dashmote.com to establish a robust online footprint.
If you find this article valuable, you may also be interested to check out more of our blog articles on franchises, such as Heineken’s Journey in Southeast Asia and Canned Beverages Landscape of 2023.
Follow us on LinkedIn @Dashmote to stay up-to-date with the latest food delivery data insights globally.
The aroma of competition is brewing in the coffee industry as CosMc's, a new concept by McDonald's, takes its first steps into the market. With the inaugural CosMc's location already gracing Bolingbrook, Illinois, and plans for expansion in the thriving metro areas of Dallas-Fort Worth and San Antonio, Texas, the coffee landscape might be about to witness a significant transformation.
According to insights from William Blair analyst Sharon Zackfia, CosMc's is deemed unlikely to pose a substantial threat to Starbucks' established dominance [1]. However, understanding the nuances of each player's strategy is crucial for brands looking to expand their online presence and brand dominance.
Motivated by our curiosity, we embarked on a thorough investigation into the dynamic competition between CosMc's and the coffee giant, Starbucks. Our focus centered on understanding Starbucks' current presence across the US, aiming to gain insights into the magnitude of the challenge that CosMc's faces as it strives to ascend to the heights set by the established coffee powerhouse.
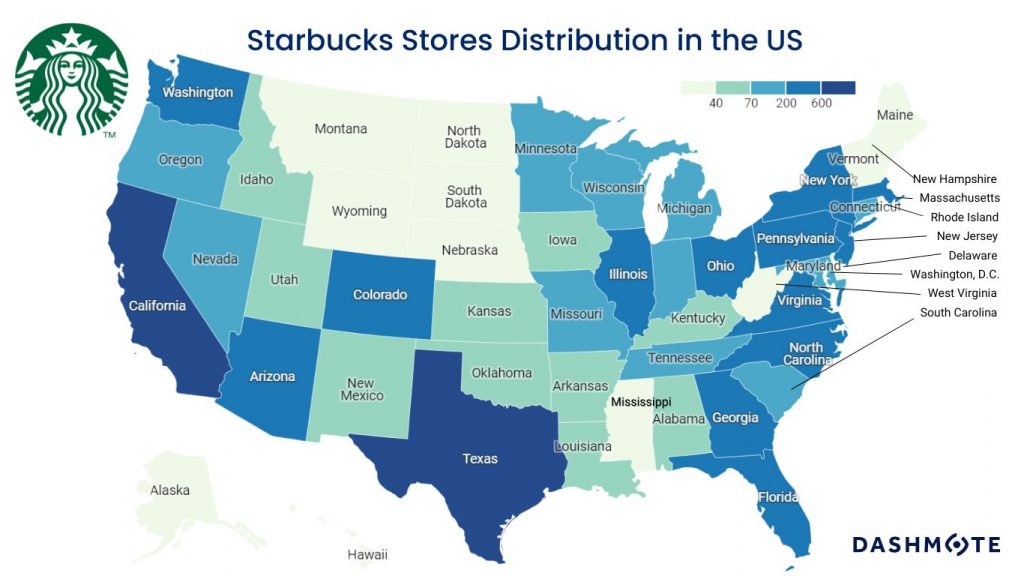
Our exploration takes us deep into Starbucks' distribution strategies, providing a comprehensive view into its physical and digital presence. We conducted research on Starbucks shops based on their food delivery presence as well as their geographical location at the end of 2023, in order to make a comparison between their physical and digital presence. The data unravels intriguing patterns in Starbucks' footprint across the United States.
- Diverse Market Saturation: The FSA dataset uncovers significant variations in the number of Starbucks outlets across different states. While California boasts a substantial presence with over 1300 outlets, Wyoming and Vermont have less than 10 stores each, signaling diverse market saturation and untapped growth opportunities.
- Top Performing States: Starbucks excels in California, Texas, and Florida, strategically saturating these populous and diverse states, particularly in urban areas. This widespread presence ensures accessibility and visibility, catering effectively to the diverse demographics of these states and building a broad customer base. The success is fueled by culturally resonant marketing strategies, turning Starbucks into more than just a coffee chain—it’s a cultural fixture [2]. This integration enhances brand loyalty and fosters a sense of community. These states provide valuable insights for expansion strategies. Analyzing urban and rural distribution unveils Starbucks' market strategy. Dashmote's geolocalization data, including contact information, offers a comprehensive view, aiding companies in tailoring strategies for suburban or rural markets.
- Market Penetration in the East: Starbucks has effectively established itself in eastern states like New York, Massachusetts, and Pennsylvania, capitalizing on urban and cultural centers. In New York, Starbucks has strategically located stores in bustling areas, catering to diverse demographics. The company's expansion in Massachusetts includes key locations in Boston and other urban hubs, targeting both residents and tourists. Additionally, Starbucks has successfully penetrated the market in Pennsylvania, where its coffee houses serve as popular meeting places.
- Potential Growth Areas: States with fewer Starbucks outlets, such as Montana, North Dakota, and Wyoming, are correlated with lower population densities. However the limited availability of Starbucks (digital) stores suggests untapped potential. Starbucks strategically allocates its resources based on market demand, population concentration, and economic factors. A thorough understanding of the unique dynamics in these regions, including demographics, competition, and cultural preferences, would provide insights into Starbucks' expansion decisions in these states, ensuring successful penetration.
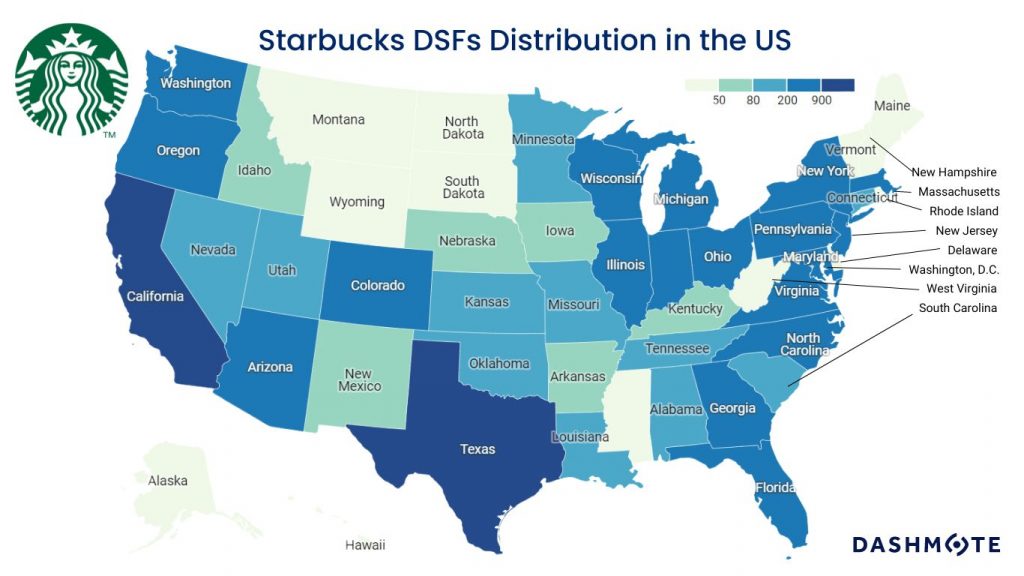
Starbucks' digital frontier is equally compelling, with a significant number of digital storefronts (DSFs) across states. California leads with almost 1,800 DSFs, followed by Texas (nearly 900) and Illinois (about 500). The higher number of DSFs compared to physical stores is attributed to the fact that a single store can leverage multiple food delivery platforms, showcasing Starbucks' substantial adoption of digital channels. For this data, we focused on the biggest players in food delivery in the US, Doordash, Uber Eats and Grubhub. Regional disparities in DSFs present opportunities for Starbucks to enhance its digital reach.
- Correlation with Physical Stores: Variations in digital and physical presence highlight strategic opportunities. Some states with a high number of physical stores also exhibit a robust digital presence, while others show disparities, suggesting room for improvement.
- Population Density Impact: In assessing the correlation between digital and physical presence, certain states, such as California, Texas, and New York, demonstrate a synergy where a substantial number of physical stores align with a robust digital presence. Conversely, states like Kansas and Oklahoma stand out for their significantly higher digital presence compared to the number of physical stores. Additionally, a noteworthy observation is that states with higher digital presence often coincide with densely populated regions, highlighting the convenience and accessibility facilitated by food delivery platforms.
- Market Adaptation and Consumer Behavior: Balancing physical and digital presence provides insights into Starbucks' adaptation to evolving consumer behaviors. States where digital presence surpasses physical stores signal a shift in consumer preferences toward online ordering.
- Digital Competitive Landscape: Comparing Starbucks' digital presence with competitors on food delivery platforms unveils the competitive landscape in the digital space, aiding in refining digital marketing and delivery strategies.
As the digital realm becomes integral to a brand's identity, the importance of a store's virtual presence is underscored. In today's landscape, relying solely on physical stores or a single food delivery platform may limit reach and accessibility. A multi-platform digital strategy enables a store, whether a large chain or a smaller establishment, to cater to diverse consumer preferences and leverage the growing trend of online ordering and food delivery, ensuring a broader and more resilient market presence
Dashmote assists enterprises in overcoming obstacles in the digital market space. As the foremost provider of big data and AI analytics solutions in the F&B sector, we enable informed strategic choices. Reach out to our team at contact@dashmote.com to establish a robust online footprint.
If you find this article valuable, you may also be interested to check out more of our blog articles on franchises, such as The World of McFlurry and Beverage Menus on European Franchises.
Follow us on LinkedIn @Dashmote to stay up-to-date with the latest food delivery data insights globally.
The US is the second largest food delivery market (behind China) globally. BusinessWire indicated that the US online food delivery market reached a value of 23.4 Billion USD in 2021, and it is expected to reach 42.6 Billion USD by 2027 [1], with an annual growth rate (CAGR 2021 – 2027) of 10.5%. By analysing data from the three main delivery platforms - DoorDash, Uber Eats, and Grubhub, we are excited to provide insights into the US food delivery market.
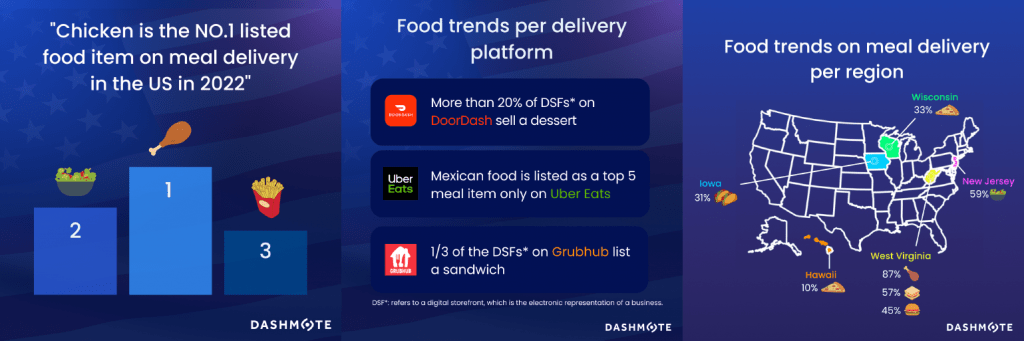
Our data reveals that chicken, salads, and fries are the top three most listed food items on food delivery in the US. Out of more than 1.3 million Digital Storefronts (DSFs*) in the US by August 2022, around 75% of all DSFs listed chicken, 50% listed salads, and 46% listed fries.
*A DSF refers to the electronic representation of a business on a food delivery platform. A business can be listed on three different food delivery platforms (e.g. DoorDash, GrubHub and Ubereats), in our data that would be counted as three DSFs and one outlet.
Our data shows that all three platforms value ease and convenience, and the top listed foods vary very slightly between these platforms. Specifically, 40% of all DSFs* on DoorDash list sandwiches, 1/3 of the DSFs on Uber Eats list rice dishes, and Grubhub has the highest % of DSFs listing desserts. Understanding the key trends and overall characteristics of food delivery platforms will benefit your business in discovering the opportunities in the market.
In the United States, West Virginia has the highest percentage of DSFs listing chicken dishes, sandwiches and burgers. New Jersey has the most DSFs listing salads. Iowa has over 1/3 of DSFs selling taco. Pizza is most popular in Wisconsin. Interestingly, Hawaii has the lowest percentage of DSFs listing pizza, which is only 10%.
Platforms such as DoorDash, Uber Eats, and Grubhub have widely opened the delivery space in the US, making it significantly easier for businesses of all sizes to sell their product online and have it delivered straight to customers. Unlocking opportunities in the complex ecosystem of the US food delivery industry requires constant tracking and analysing the latest data to gain a sophisticated understanding of where the market is heading.
If you are looking for more data insights, or interested in collaborations, please contact sales@dashmote.com.
Dashmote is visiting The Windy City: we’re joining the National Restaurant Association Show (May 21-24,2022) at McCormick Place, Chicago. It’s the largest restaurant conference in the United States. Why the City of Chicago? It’s the place to be if you’re in the foodservice industry. In addition to a great number of high-quality restaurants, major brands located their (global) HQ in the food-hub of The United States: McDonald’s, Mondelez, Mars Wrigley and US Foods. Pepsi, Tyson Foods and MillerCoors have major operations in this area.
We look forward to (finally) connecting with our partners in-person (e.g. Coca-Cola Company, Heineken and Nestle) and we’ll announce the launch of our new product. Attendees will meet their peers, learn about new products and discover new market trends.
One of these major trends in 2022 is that managing a foodservice brand or restaurant is not only about the guest's experience in-person or offline (e.g. the restaurant’s vibe, the menu and in-house services), your guest experience incorporates more than that. Have you ever thought of the impact of Food Delivery Platforms (e.g. UberEats)? And how does this influence the decision making process of your guests?
We’re here to help you. Dashmote is a Data Democratization platform that turns data into actions. Our platform can extract valuable insights from unstructured public data, think of websites and machine learning. How would this relate to your day-to-day business?
Our new product, DeliverMore, helps restaurants to optimize their online presence on Food Delivery Platforms, which results in 20% more revenue. DeliverMore shows you over-time how your location ranks for key search keywords (‘pizza’, ‘sushi’, ‘burger’) per postal code. Delivery App Optimization (DAO) helps you efficiently optimize your positioning compared to your competitors. DAO’s unique trend analysis feature allows you to unfold opportunities and strategically run marketing campaigns.
Do we need to say More?
Our team is beyond excited to welcome you at our booth (South Building — 757a — Startup Alley) and/or our networking event (Technology in the Food & Beverage Industry @NRAS2022). Reach out to Jessica Arts for exclusive access to the May 23th event (5:30 PM).