
The popularity of vegan and vegetarian cuisine has been steadily increasing for years. People are consuming less meat and other animal products such as eggs and dairy. Many reduce their consumption for animal welfare or environmental reasons, while others do so for health benefits. As a result, more people are opting for plant-based options.
This trend is expected to continue growing. For example, in the 1980s, vegetarianism and veganism were considered extreme, and there were very few plant-based options available. Today, the variety of plant-based products has expanded dramatically. According to reports by PETA, by 2050, more than 25% of the animal meat market is expected to be the vegan market, that is, the plant-based market.
We analyzed DoorDash, Ubereats, Justeats, Wolt, Takeaway, Foodora and Deliveroo in a period of one year in six veg-friendly countries—Australia, Germany, Spain, Italy, Sweden, and the United Kingdom—to see how this trend is reflected in food delivery platforms.
When looking at the number of vegan and vegetarian digital storefronts in these five countries, the UK stands out. The UK takes the lead with 48,535 vegan or vegetarian storefronts on digital platforms. This dominance is also reflected in the number of vegan or vegetarian digital storefronts per 10,000 inhabitants in the UK, which is 7.1. Australia follows with 4.1, and Sweden with 1.5 digital storefronts per 10,000 people. Germany and Spain trail with 0.5 and 0.6 vegan or vegetarian restaurants per 10,000 inhabitants, respectively.
Even though the UK has the most vegan and vegetarian options, Germany has seen the largest increase in the number of vegan and vegetarian digital storefronts in the past year. In Germany, the number of digital storefronts grew from 4,800 in 2023 to 6,400 in 2024, marking a significant 33% increase. Australia follows with a 13% increase, and Italy is close behind with a 12% rise. In contrast, the UK shows a small growth of just 0.5%.

When we look at the proportion of vegan and vegetarian restaurants compared to the total number of digital storefronts, the UK still leads the pack. But there's been a drop from 18.6% in 2023 to 15.5% in 2024. The only country where this share has slightly gone up is Sweden.
Looking at the total number of digital storefronts on food delivery platforms, this number is increasing relatively faster than the number of vegan/vegetarian restaurants.

Despite the growing interest in vegan and vegetarian diets, there can be a few reasons why we don't see more of these restaurants on food delivery apps:
Market Demand and Size, despite the increasing popularity, the vegan and vegetarian market is still relatively small compared to the overall food market. In many places, there simply isn't enough demand for vegan and vegetarian options to support a large number of restaurants dedicated solely to these diets. Also, many people still prefer traditional diets with meat and animal products, which means there's a bigger customer base for regular restaurants.
Restaurant Conversion and Menu Limitations, many restaurants on digital storefronts offer vegan and vegetarian dishes as part of their menu expansion. However, they often do not convert to fully vegan or vegetarian menus and, therefore, are not classified as entirely vegan or vegetarian. This leads to an underrepresentation of fully vegan or vegetarian restaurants on food delivery apps and are also not taken into account in this research.
Economic and Visibility Challenges, it can be less attractive for vegan and vegetarian restaurants to be listed on food delivery platforms for a few reasons. They often have to pay more for specialty ingredients, which can be pricier than regular ones. Also, smaller vegan and vegetarian restaurants might not have much money to spend on advertising, making it harder for them to get noticed on these apps and attract customers.
While vegan and vegetarian cuisine gains popularity, its presence on food delivery platforms encounters challenges. Even though the UK has the most listings, the proportion of vegan and vegetarian options has gone down. Similarly, in Germany, although there are more listings, the share of vegan and vegetarian restaurants hasn't changed much. The only country where we notice a small increase in market share is Sweden. Barriers for vegan or vegetarian restaurants can be the small size of the niche market and financial constraints are holding back wider representation.
We also have to take into account that only restaurants that are fully vegetarian or vegan are listed on food delivery apps and that other restaurants that offer a wider range than vegan or vegetarian are excluded from this research. The amount of vegan or vegetarian restaurants are not growing, but possibly the overall vegan food options are..
Dashmote assists enterprises in overcoming obstacles in the digital market space. As the foremost provider of big data and AI analytics solutions in the F&B sector, we enable informed strategic choices. Reach out to our team at contact@dashmote.com to establish a robust online footprint.
Follow us on LinkedIn @Dashmote to stay up-to-date with the latest food delivery data insights globally.
Spain's rich culinary diversity makes it an ideal landscape for the growing food delivery industry. As the country that brought the world paella, tapas, and sangria, Spain's cuisine is as varied as its geography. The data presents a global trend where food delivery services are becoming an integral part of daily life. From 2019 to 2022, the online food delivery market in Spain more than doubled its revenue, reaching over €5 billion, showcasing an insatiable appetite for dining at the digital table [1]. With a remarkable surge in revenue in 2023 to €6.6 billion, the online meal and grocery delivery industry's financial trajectory highlights growing demand and a hungry consumer base eager for the convenience of food delivery [2]. This analysis taps into Dashmote's extensive data to provide insights on the dynamics of Food Service Aggregators (FSAs) and the potential that lies within Spain's food delivery sector.
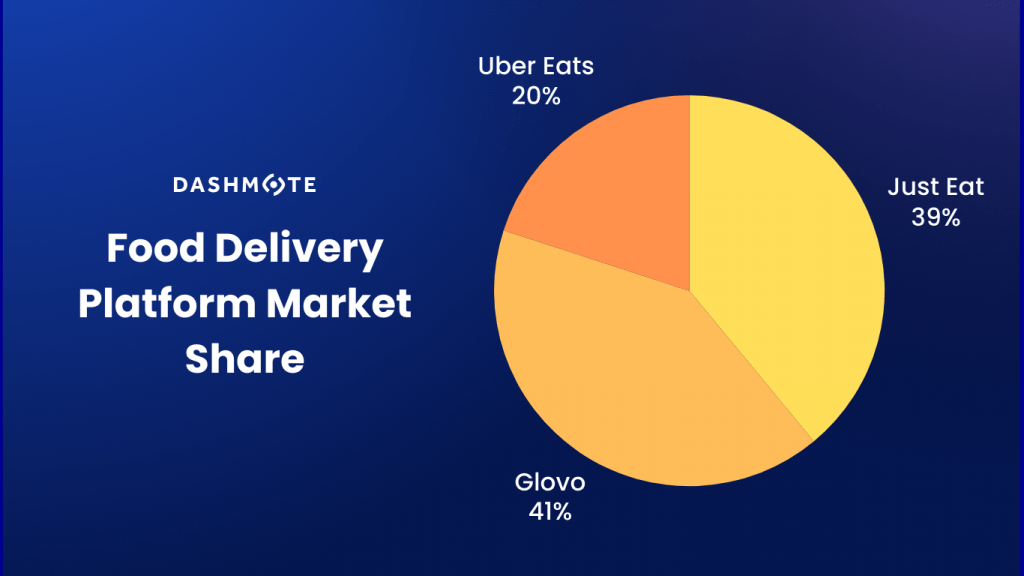
The Spanish food delivery market has experienced remarkable growth, now featuring over 108.6k DSFs (digital storefronts) across the country. We noticed intense competition primarily among the three major platforms we gathered insights from: Glovo, JustEat Takeaway.com, and Uber Eats. Glovo leads with a 41% market share, underscoring its extensive reach. JustEat Takeaway.com is a close second with 39%, while Uber Eats holds the third position with a 20% share.
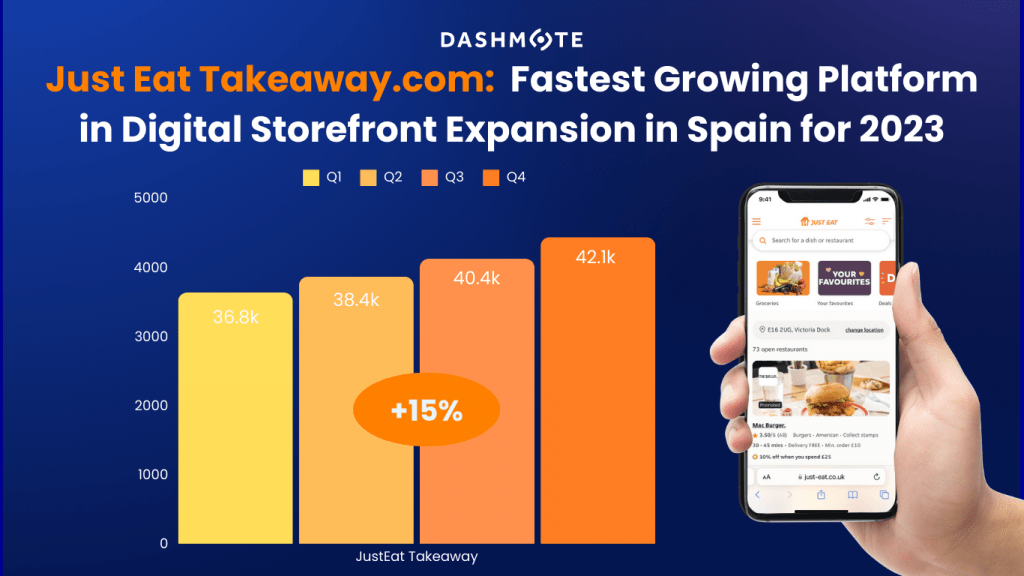
Just Eat Takeaway.com is the fastest growing platform, with over 42.1k digital storefronts (DSFs) and experiencing a significant growth rate in comparison to its competition, 15% growth from Q1 to Q4 of 2023. With its rapid expansion, Just Eat Takeaway.com is gaining ground on Glovo, the current go-to choice for food delivery in Spain.
Madrid stands out as the core of Spain's food delivery operations, commanding 17% of the nation's digital storefronts. This concentration highlights the city's importance to the national market, as well as the potential it has for expansion.
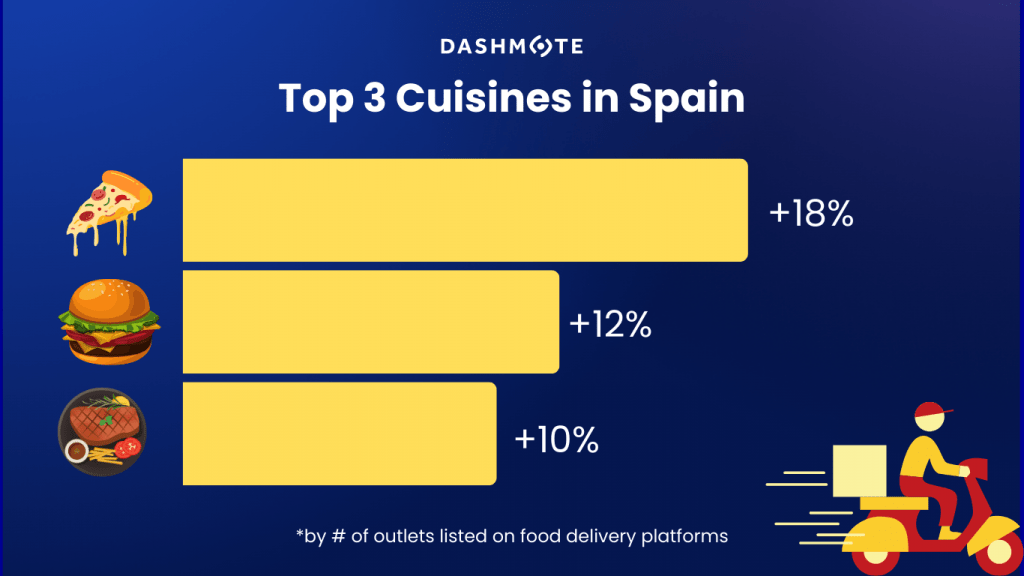
An analysis of cuisine types reveals a diverse palate among Spanish consumers, with pizza (18%), burgers (12%), and American cuisine (10%) topping the list of favorites. Dashmote’s analysis of online food imagery and menu offerings across platforms enables businesses to strategically expand their market presence, equipped with accurate, real-time data on popular cuisines, emerging food trends, and market opportunities.
Spain's food delivery market is constantly changing and growing. Gaining an understanding of market trends is important to gain strategic advantage, especially for new entrants or brands trying to broaden their offerings and increase their market share. Dashmote offers the insights necessary to effectively navigate this competitive landscape.
Dashmote assists enterprises in overcoming obstacles in the digital market space. As the foremost provider of big data and AI analytics solutions in the F&B sector, we enable informed strategic choices. Reach out to our team at contact@dashmote.com to establish a robust online footprint.
If you find this article valuable, you may also be interested to check out more of our blog articles on franchises, such as Empowering Heineken NL’s Online Presence Through Data-Driven Strategies and Diageo’s Digital Presence and Growth in the UK.
Follow us on LinkedIn @Dashmote to stay up-to-date with the latest food delivery data insights globally.
When savoring a Big Mac, one may not realize its potential as a tool for understanding global economics. In a previous article, we introduced the Food Delivery Big Mac Index, which monitored Big Mac prices on food delivery platforms across 35 countries for three quarters in 2022. This index helps us comprehend variations in purchasing power, currency value, and inflation. Building on this topic, in this new article, we focus on the last quarter of 2022 and the first quarter of 2023, analyzing how Big Mac prices have evolved worldwide. Our analysis uncovers interesting trends among countries and discusses the implications of these patterns for the food and beverage industry. To provide a comprehensive perspective on global prices and their economic relevance, we compare our findings with The Economist's Big Mac research.
In our previous article, we mentioned that the Big Mac is great for comparisons because it's widely available and consistent worldwide [1]. The index can help us understand currency values by comparing burgers in two countries, showing if a currency might be over or undervalued [2]. The Big Mac Index not only simplifies the concept of exchange rates but also shows how burger prices change over time, revealing inflation. By converting all Big Mac prices into a single currency, the index emphasizes cost differences around the world, giving insights into costs like rent, equipment, labor, and other factors.
Why is this important for those in the food and beverage industry? The Big Mac Index is relevant because it helps global companies develop pricing strategies, enabling them to adjust prices based on currency values. For example, a company may decide to charge a higher price for their product in a country with an overvalued currency, like Switzerland, compared to a country with a lower currency value, such as Indonesia.
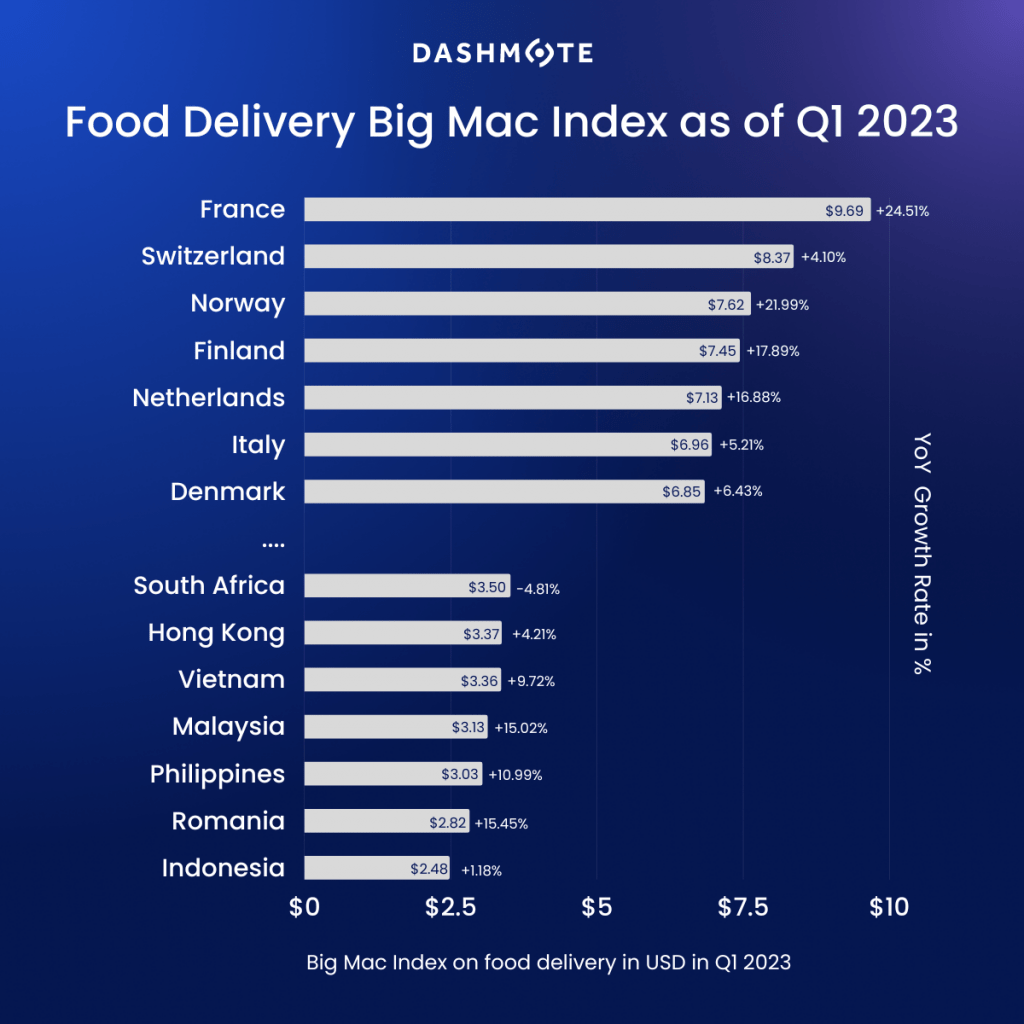
Our data showed that in Q1 2023 the maximum price of a Big Mac in France is around €8.8 ($9.66), making it one of the most expensive, while in Indonesia, the same burger is only IDR 37,130 ($2.48). This big difference shows the variety in economic conditions and buying power in different countries. The average Big Mac price worldwide is around $5.43, with prices varying greatly among countries, reflecting various factors like local production costs, taxes, and consumers' willingness to pay. This information emphasizes the importance of understanding the economic landscape when studying Big Mac prices worldwide.
Poland saw a significant 66.85% increase from Q1 2022 to Q1 2023. Its non-Euro currency, the Polish zloty, reached record lows against the euro and dollar in 2022 [3] and factors like the war in Ukraine and a deteriorating economy contributed to currency fluctuations. Turkey's Big Mac price jumped by a huge 154.63% during this time, reflecting worries about inflation and economic stability in the country. France, which already had high Big Mac prices, experienced a 24.51% increase from €7.10 in Q1 2022 to €8.84 in Q1 2023. This could mean the French economy is growing as prices usually go up when the demand for goods and services increases.
Norway, also known for high Big Mac prices, had a 21.99% increase from $6.30 in Q1 2022 to $7.61 in Q1 2023. This might indicate economic growth in Norway and a higher willingness to spend on fast food. However, since Norway had one of the highest Big Mac prices in Q1 2022, the increase could also be due to other factors, like changes in taxes or ingredient costs.
In contrast, Brazil and South Africa showed negative growth rates of -1.30% and -4.81%, signaling unique economic situations. The fast food industry has grown recently in both countries [4,5]. In Brazil, this growth is driven by a rising middle class with more disposable income. Meanwhile, South Africa's competitive hospitality sector, the largest food service market in Africa, is expected to grow despite economic challenges. The growing demand for diverse fast food options has boosted the industry in both countries.
What does The Economist [6] think about all this? They've also been tracking Big Mac prices and believe that the cost of the burger reflects wider inflation trends. Our findings match their observation that the average price of a Big Mac in the US has gone up more than 6% to $5.36 over the past two years. However, we discovered that some countries like France, Poland, and Turkey have seen even bigger price increases. This interesting Big Mac story highlights the need to understand global prices and their effects on the food and beverage industry.
For professionals in the food and beverage industry, knowing these global price trends is essential. The Big Mac Index is an easy and engaging way to compare costs across countries, helping businesses make smart decisions in a complicated economic world. The data on Big Mac price changes from Q1 2022 to Q1 2023 provides valuable insights into economic health, consumer preferences, and more, allowing industry stakeholders to make well-informed decisions regarding pricing, marketing, and other aspects of their business.
Dashmote is the leading big data and AI analytics company in the food & beverage industry. We help F&B enterprises by empowering leaders and analysts to track and analyze publicly available data to contribute to making strategic decisions for your brand. Want to know more about retrieving market insights across food delivery and F&B?
→ Please contact sales@dashmote.com.
Southeast Asia is known for its vibrant and diverse food culture, offering a unique blend of flavors and dishes. The region is a melting pot of culinary delights, with each nation embracing its own traditions while also exploring regional and global flavors. In this exploration, we analyzed data from locations on food delivery across six countries to uncover their culinary preferences and discover which nations have the most adventurous palates.
In Thailand1, the unwavering love for its local cuisine is evident, with Thai dishes representing over 69% of digital storefronts. This preference is not only due to the delicious flavors and fresh ingredients but also the support from the Thai government, which promotes Thai cuisine through ‘gastrodiplomacy’. Accompanying this love for local cuisine is a fondness for freshly prepared meals such as cooked-to-order (20%).
Meanwhile, Malaysia's culinary scene is often thought to be predominantly local. However, our research underscores the nation’s love of fusion cuisine. As journalist and author Dawn Tan notes in Food From the Heart: Malaysia’s Culinary Heritage (2004), "Malaysian cuisine defines fusion. And it’s been that way for over a hundred years. An early convergence of cultures from different worlds..." The quote emphasizes Malaysia's adventurous palate, which is always eager to explore new flavors and ingredients. This open-mindedness is reflected in the diverse array of Malaysian (51%), Chinese (10%), and other Asian dishes (81%) found in the country's digital storefronts.
Singapore, a true melting pot of cultures, is home to people of various nationalities, each with their own unique cuisine preferences. The Singaporean food landscape reveals this diversity with a vast array of culinary offerings from different cultures. From Asian (25%) and Chinese (20%) to Western (15%) and Japanese (12%), the nation's appetite for a wide variety of food options is apparent. This diverse culinary scene is a testament to Singapore's multicultural society and its unique blend of traditional and modern influences.
Vietnam's culinary landscape is characterized by its deep-rooted love for its local cuisine, with Vietnamese dishes accounting for 60% of the total storefronts. The popularity of dishes like pho (a noodle soup), banh mi (a type of sandwich), and cha gio (fried spring rolls) demonstrate the Vietnamese people's appreciation for comforting and delicious food that can be prepared quickly and easily. Our data also shows that Vietnam's food scene features a fondness for comfort food and beverages, such as tea (20%), and coffee (19%). These popular beverages add an interesting dimension to Vietnam's culinary identity, showcasing the country's love for rich and flavorful flavors that can be enjoyed at any time of the day.
In the Philippines, fast food and casual dining are popular choices among the population, with fast food and sugary drinks being common types of food marketing seen by children and adolescents on social media apps, according to a BBC2 study. This insight suggests that F&B companies looking to expand in the Philippines could benefit from increasing the offer of fast food and sweetened beverages in their product line. However, it's also important to remember that the country embraces its Asian (34%) and Filipino (30%) roots, so incorporating local flavors and ingredients into products may further appeal to consumers.
On the other hand, Cambodia's strong café culture, exemplified by coffee's popularity (24%), showcases the country's diverse culinary preferences, including Asian, noodle, and seafood dishes. F&B companies looking to tap into the Cambodian market may want to consider incorporating coffee into their product line if it's not already included, as it appears to be a popular beverage in the country. Additionally, offering Asian, noodle, and seafood dishes in your product line could also be appealing to Cambodian consumers, catering to their evolving food landscape and openness to different flavors and ingredients.
Finally, in our analysis of food delivery preferences, Indonesia's love for its traditional cuisine shines through. Rice, the staple food of Indonesia, leads the way, accounting for 25% of digital storefronts. Chicken dishes (20%) and noodles (10%) further demonstrate the nation's appreciation for their local culinary heritage and the variety of flavors and textures present in Indonesian cuisine. The prominence of rice, chicken, and noodles in their culinary landscape reflects their love for familiar, comforting flavors that showcase the best of Indonesian cuisine.
By analyzing the popularity of different cuisines in various countries, we can gain a deeper understanding of regional food preferences and consumer behavior. Our study reveals that Malaysia and Singapore take the lead as the most adventurous eaters in Southeast Asia, showcasing a willingness to explore the vast array of global cuisine.
The insights gained from this analysis offer businesses an opportunity to pursue ambitious goals and grow in a rapidly evolving industry. By embracing the diversity and richness of Southeast Asia's culinary heritage, F&B companies can unlock hidden potential and create innovative, successful ventures. We hope this article offers valuable insights and inspiration for businesses aiming to make a splash in the Southeast Asian Food Delivery Industry.
Dashmote is the leading big data and AI analytics company in the food & beverage industry. We help F&B enterprises by empowering leaders and analysts to track and analyze publicly available data to contribute to making strategic decisions for your brand. Do you feel interested in the snack market on food delivery? Check out our data insights on chocolate. Want to know more about retrieving market insights across food delivery and F&B?
→ Please contact sales@dashmote.com.